 Collaboration Area
The solutions from Collaboration area of ConceptDraw Solution Park extend ConceptDraw PRO and ConceptDraw MINDMAP software with features, samples, templates and vector stencils libraries for drawing diagrams and mindmaps useful for collaboration.
 Telecommunication Network Diagrams
Telecommunication Network Diagrams solution extends ConceptDraw PRO software with samples, templates, and great collection of vector stencils to help the specialists in a field of networks and telecommunications, as well as other users to create Computer systems networking and Telecommunication network diagrams for various fields, to organize the work of call centers, to design the GPRS networks and GPS navigational systems, mobile, satellite and hybrid communication networks, to construct the mobile TV networks and wireless broadband networks.
HelpDesk
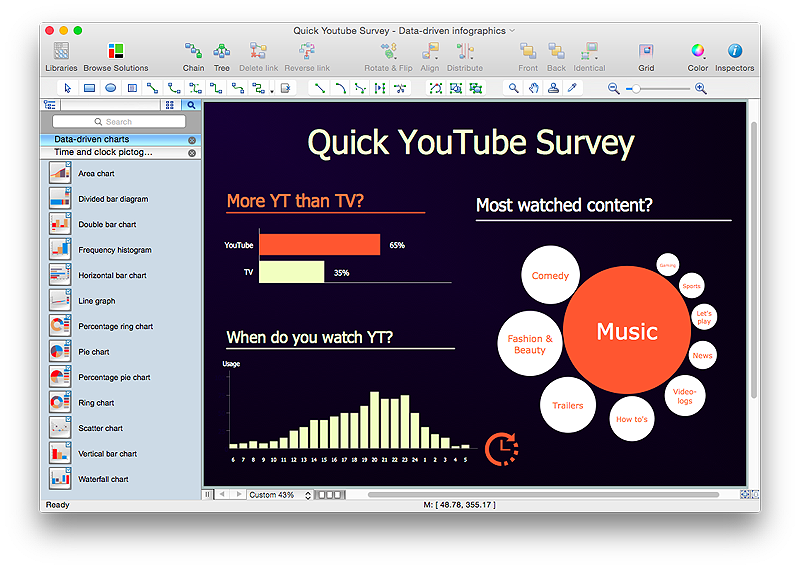
How to Create Data-driven Infographics
Data-driven infographics are used in wildly disparate areas of business and commerce. To make effective Data-driven infographics, it's useful to have a wide variety of graphical elements — icons, clipart, stencils, charts and graphs — to illustrate your diagram. ConceptDraw Data-driven Infographics solution provides all the tools you need to present data as described by this article — as well as the charts mentioned previously, you can find histograms, divided bar charts, ring charts, line graphs and area charts — meaning you can find the perfect medium for displaying a certain type of data. It allows you to draw data driven infographics quickly and easily using the special templates and vector stencils libraries.It can be used to quickly communicate a message, to simplify the presentation of large amounts of data, to see data patterns and relationships, and to monitor changes in variables over time.
 IDEF Business Process Diagrams
Use the IDEF Business Process Diagrams solution to create effective database designs and object-oriented designs, following the integration definition methodology.
 SWOT and TOWS Matrix Diagrams
SWOT and TOWS Matrix Diagrams solution extends ConceptDraw PRO and ConceptDraw MINDMAP software with features, templates, samples and libraries of vector stencils for drawing SWOT and TOWS analysis matrices and mind maps.
 ConceptDraw Dashboard for Facebook
ConceptDraw Dashboard for Facebook solution extends ConceptDraw PRO software with a dynamically updated visual dashboard, which shows lifetime total likes, daily friends of fans, and daily page views, information you can receive from Facebook Insights.
- What Is a Concept Map | Flowchart Marketing Process. Flowchart ...
- Internet marketing - Concept map | Marketing - Vector stencils library ...
- CS Odessa Announces Management Infographics Solution for ...
- Data Flow Diagram Symbols. DFD Library | Data Flow Diagram ...
- Fishbone Diagrams | Fishbone Diagram | Process Flowchart ...
- New Education Infographics Solution Now Available for ...
- Marketing - Vector stencils library | Rack Diagrams | With The Aid Of ...
- Marketing program - Infographics | Donut Chart Templates
- Flow chart Example. Warehouse Flowchart | Sales Process ...
- ConceptDraw Office: What Our Users Say
- Circle Chart Marketing
- Sales Process Flowchart . Flowchart Examples | Competitor Analysis ...
- How to Create Marketing Infographics | Marketing | Flowchart ...
- Circular Flow Diagram Template | Circle Spoke Diagram Template ...
- Target market - Onion diagram | Target market | Target diagrams ...
- Circle Diagrams | What Is a Circle Spoke Diagram | Pie Chart ...
- How to Create Marketing Infographics | Marketing Infographics | Use ...
- Circle Diagrams | What Is a Circle Spoke Diagram | How To Convert ...
- Basic Flowchart Symbols and Meaning | Process Flowchart ...
- Process Flowchart | Sales department - Vector stencils library | Office ...
