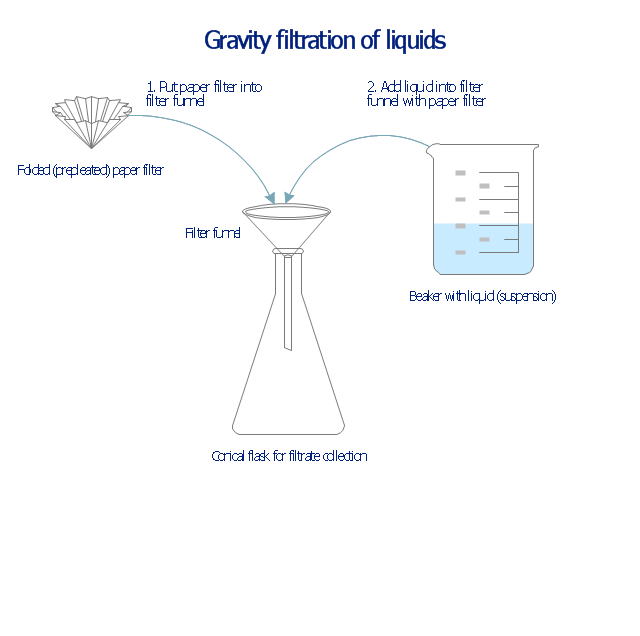
This chemical laboratory technique drawing depict gravity filtration of liquid through prepleated paper filter step-by-step.
1. Put folded filter paper cone into glass filter funnel inserted into neck of conical (Erlenmeyer) flask.
2. Add liquid suspension from the glass beaker with a spout into the funnel with paper filter.
3. Collect filtrate in the conical flask and solid on the paper filter in the funnel.
"Filtration is commonly the mechanical or physical operation which is used for the separation of solids from fluids (liquids or gases) by interposing a medium through which only the fluid can pass. The fluid that pass through is called a filtrate. Oversize solids in the fluid are retained, but the separation is not complete; solids will be contaminated with some fluid and filtrate will contain fine particles (depending on the pore size and filter thickness)." [Filtration. Wikipedia]
"Filter paper is a semi-permeable paper barrier placed perpendicular to a liquid or air flow. It is used to separate fine solids from liquids or air." [Filter paper. Wikipedia]
The chemical lab drawing example "Gravity filtration of liquids" was created using the ConceptDraw PRO diagramming and vector drawing software extended with the Chemistry solution from the Science and Education area of ConceptDraw Solution Park.
Network Security Devices
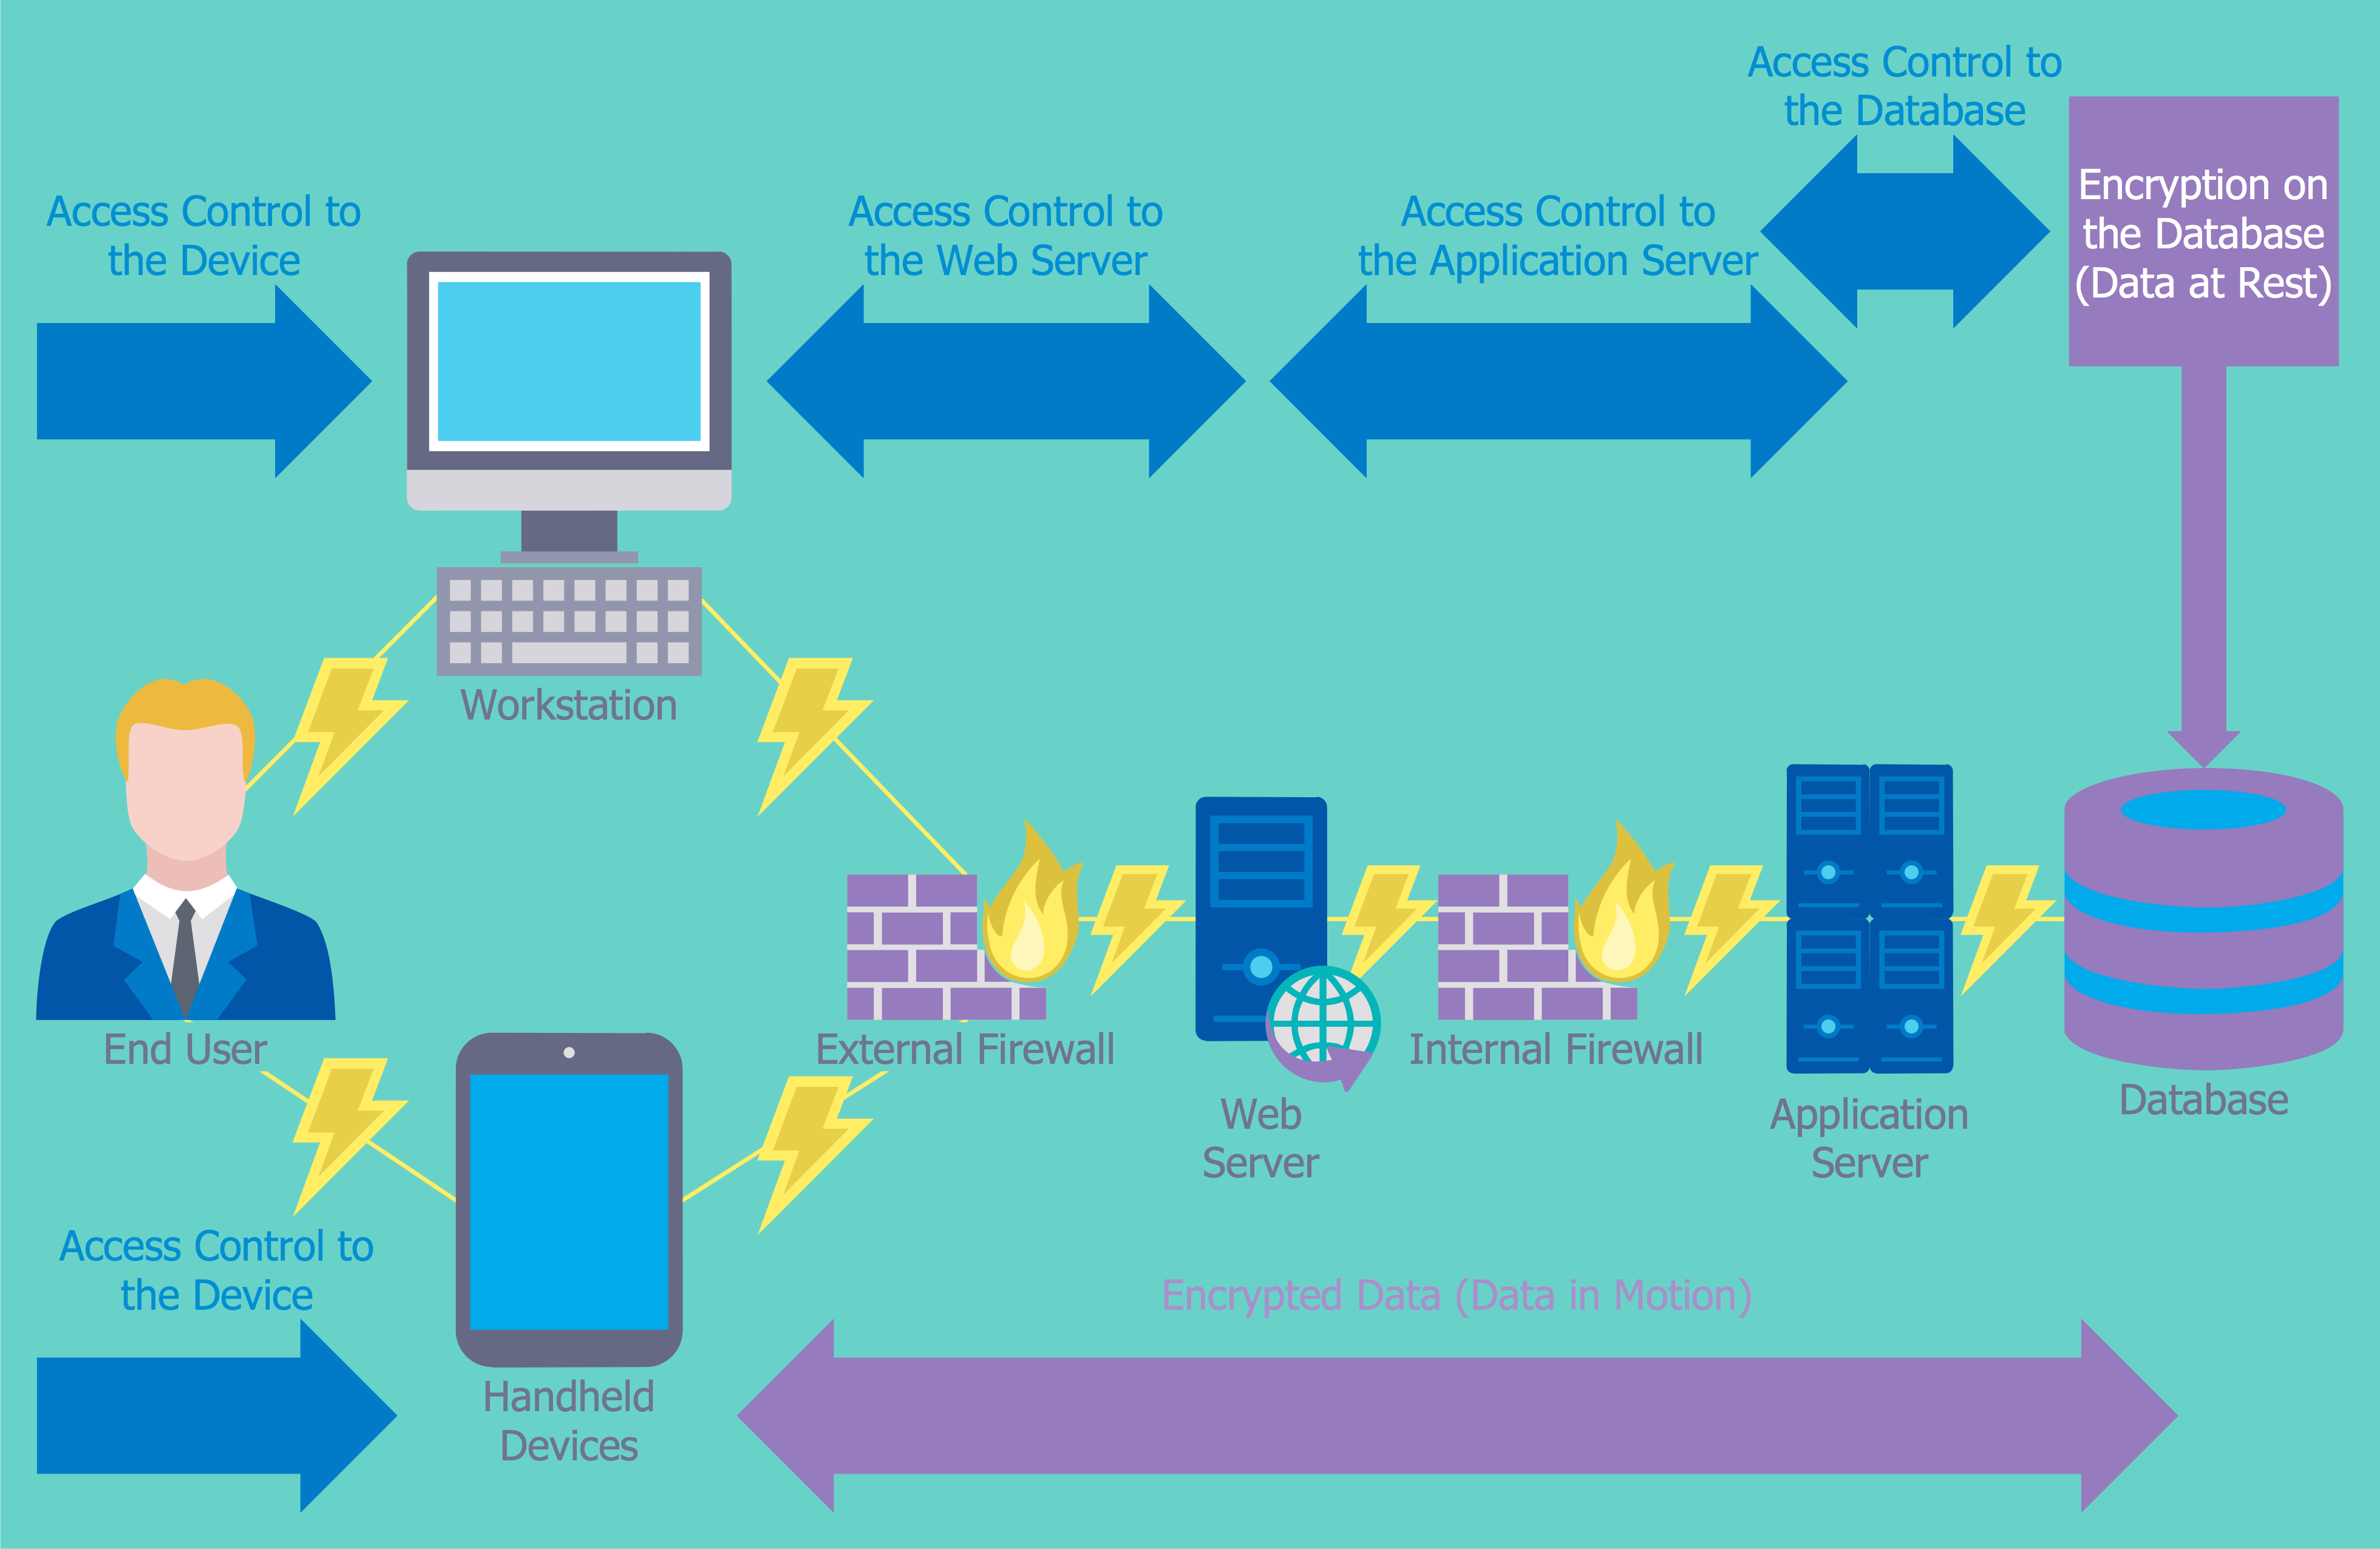
How to describe the necessity of using network security devices and visually illustrate this information? Now, it's very easy thanks to the ConceptDraw PRO diagramming and vector drawing software extended with Network Security Diagrams Solution from the Computer and Networks Area of ConceptDraw Solution Park.
 Chemistry
This solution extends ConceptDraw PRO software with samples, template and libraries of vector stencils for drawing the Chemistry Illustrations for science and education.
Healthy Diet Plan
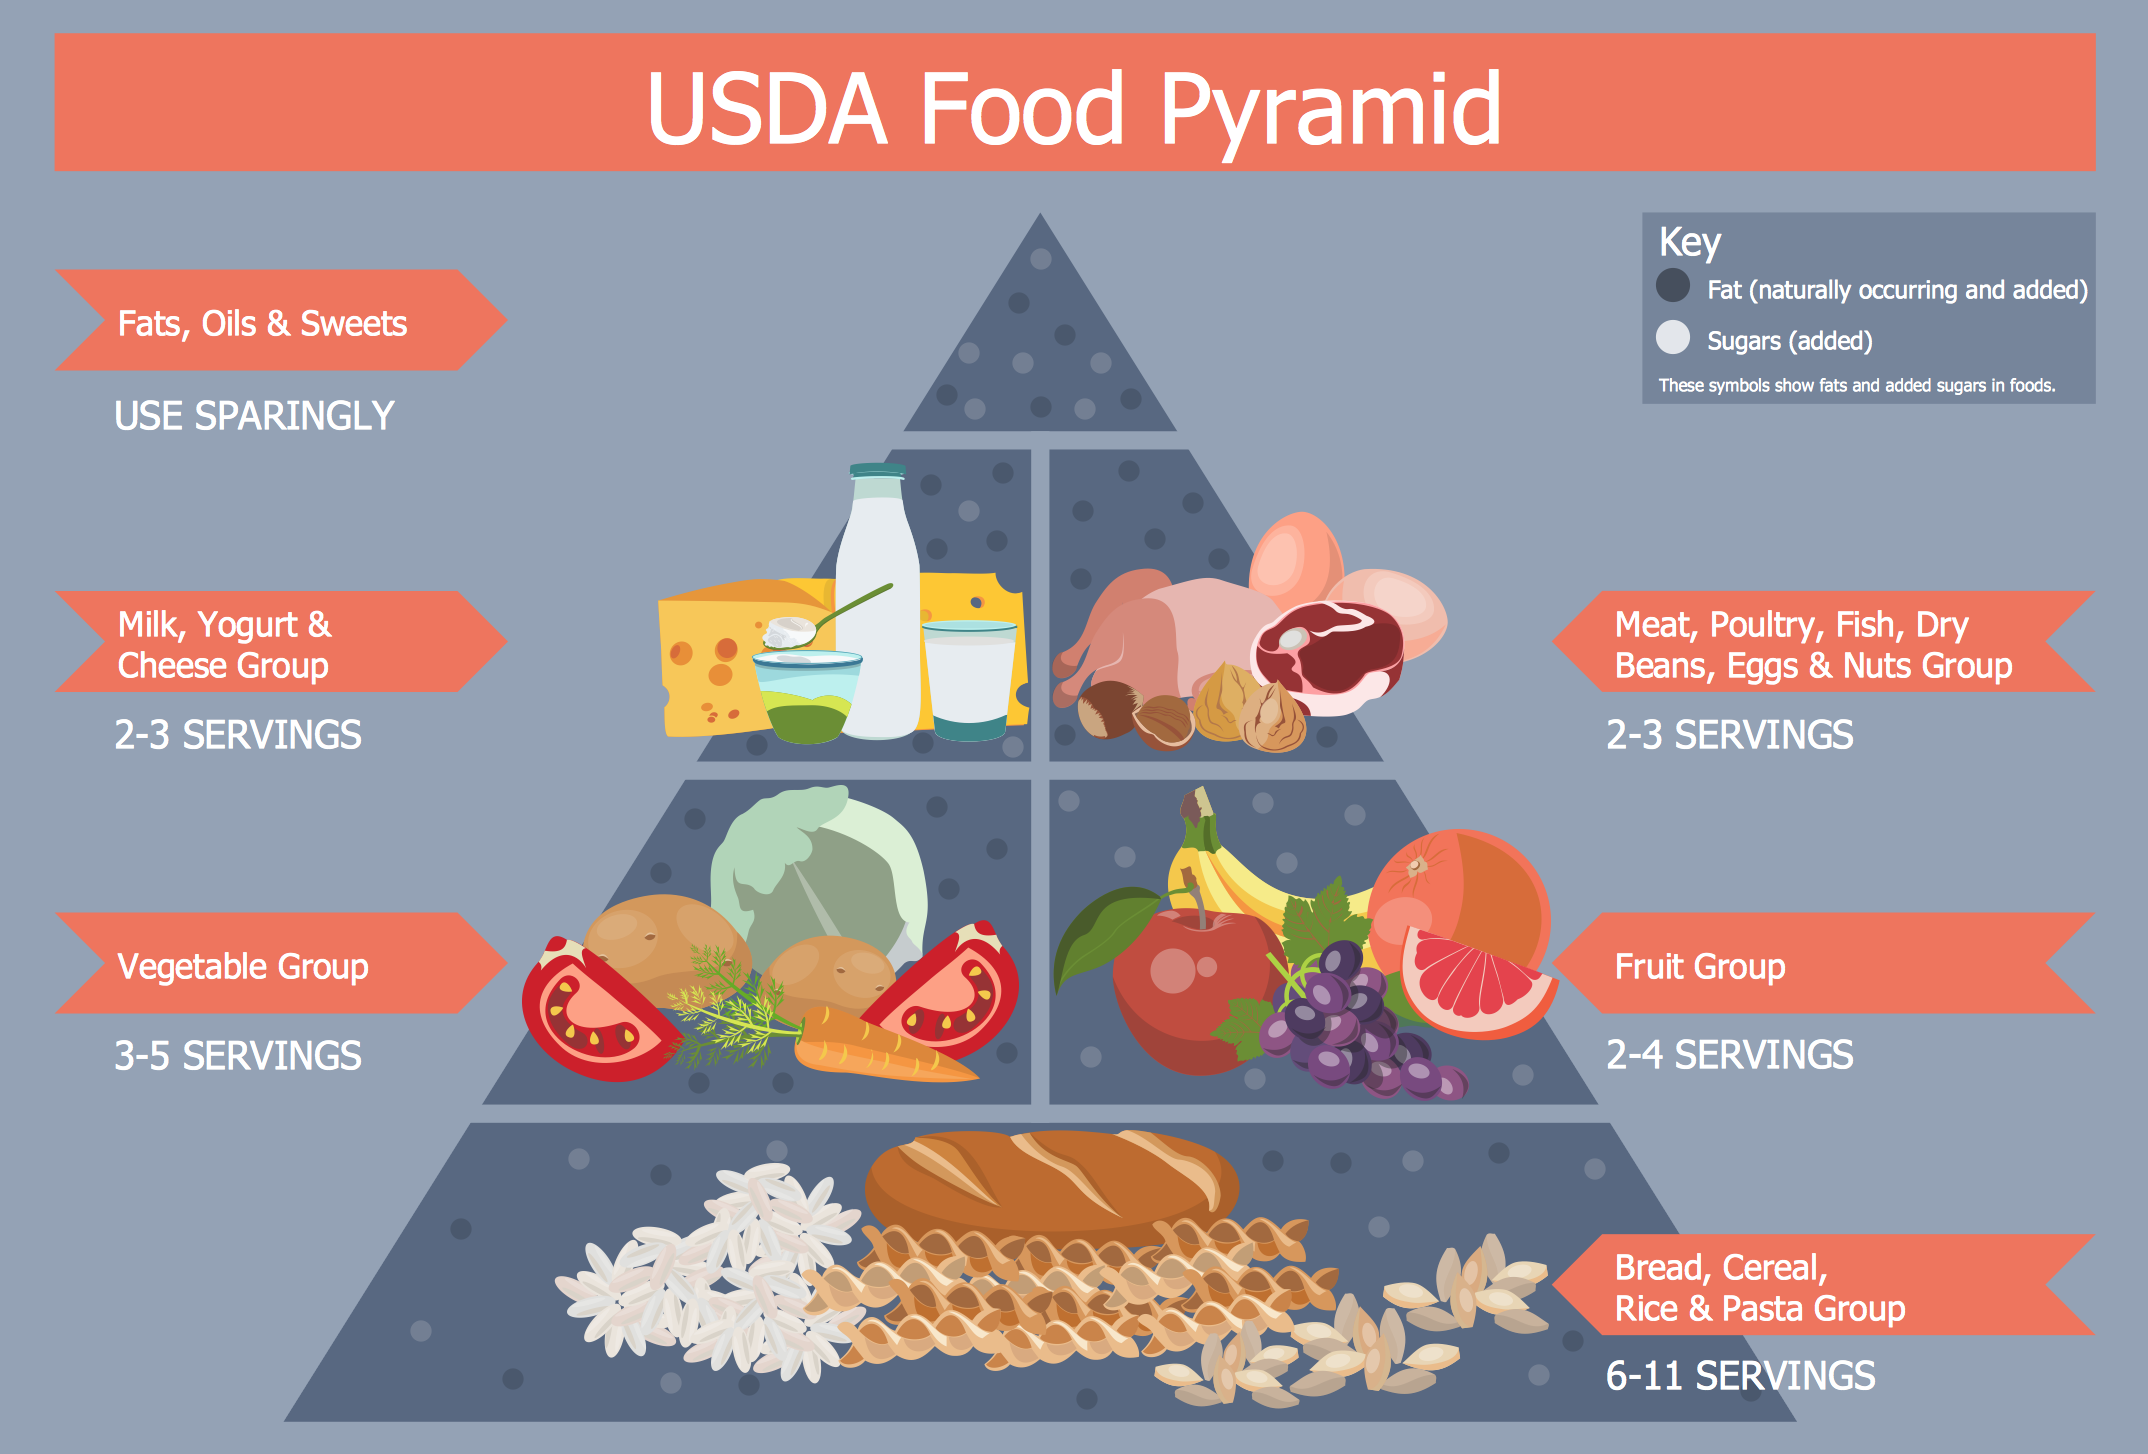
The human organism is so constituted that for a full life you need a wide range of nutrients, minerals and vitamins. To get all this, it is necessary to enrich your nutrition by natural and healthy food. The same microelements and nutrients are contained in different foods, so it is very important to create your own healthy diet plan, based on your preferences and containing the balance of nutrients suitable for you. ConceptDraw PRO diagramming and vector drawing software extended with Health Food solution from the Food and Beverage area of ConceptDraw Solution Park contains powerful tools for designing healthy diet plan.Healthy Food Ideas
Representation of healthy food ideas and designing illustrations for healthy food recipes, decoration healthy diet plan and drawing healthy foods images has never been easier than now thanks to the ConceptDraw PRO diagramming and vector drawing software enhanced with Health Food solution from the Food and Beverage area of ConceptDraw Solution Park.
 Health Food
The Health Food solution contains the set of professionally designed samples and large collection of vector graphic libraries of healthy foods symbols of fruits, vegetables, herbs, nuts, beans, seafood, meat, dairy foods, drinks, which give powerful possi
Design Pictorial Infographics. Design Infographics
In the course of recent decades data visualization went through significant development and has become an indispensable tool of journalism, business intelligence and science. The way visual information may be conveyed is not limited simply to static or dynamic representation, it can also be interactive. Infographics can be conditionally divided into several general levels. Primarily, this is level of visualization of information, its interpretation and association on any ground. Second level can be defined as a visualization of knowledge, depiction of thoughts and ideas in the form of images or diagrams. Finally, the level of data visualization, which processes data arrays in charts, enabling the information to be more clearly perceived. You can also identify the main approaches to the creation of infographics: exploratory and narrative. Exploratory method insists on minimalist design in favor of data precision without unnecessary details and is common for scientific researches and ana- Gravity filtration of liquids | Chemistry Symbols and Meanings ...
- Design elements - Laboratory equipment | Gravity filtration of liquids ...
- Gravity filtration of liquids | Example Of Laboratory Apparatus
- Filtration Examples
- Gravity filtration of liquids | Chemistry | Chemistry Symbols and ...
- Diagram Of Filtration
- Gravity filtration of liquids | Water cycle diagram | Design elements ...
- Gravity filtration of liquids | Glassware In Science Labs
- Design elements - Laboratory equipment | Gravity filtration of liquids ...
- Gravity filtration of liquids | Embedded Filtering Capabilities in ...
- Gravity filtration of liquids | Circle-Spoke Diagrams | Drawing Of ...
- Gravity filtration of liquids | Design elements - Pumps | Natural gas ...
- Gravity filtration of liquids | Physics Diagrams | Chemistry Lab Name ...
- Gravity filtration of liquids | Design elements - Laboratory equipment ...
- Laboratory equipment - Vector stencils library | Gravity filtration of ...
- Gravity filtration of liquids | How to Create a Custom Filter in ...
- Chemistry | Gravity filtration of liquids | Chemistry Symbols and ...
- Chemistry | Chemistry Symbols and Meanings | Gravity Filtration ...
- Design elements - Laboratory equipment | Design elements ...
- Chemistry Drawings | Natural gas condensate - PFD | Gravity ...


