ConceptDraw MINDMAP : Brainstorming, Mind Mapping for macOS and Windows
ConceptDraw MINDMAP is a powerful business and personal productivity software application that provides visual organization and access to information for individuals and organizations.
 Sales Dashboard
Sales Dashboard solution extends ConceptDraw DIAGRAM software with templates, samples and library of vector stencils for drawing the visual dashboards of sale metrics and key performance indicators (KPI).
HelpDesk
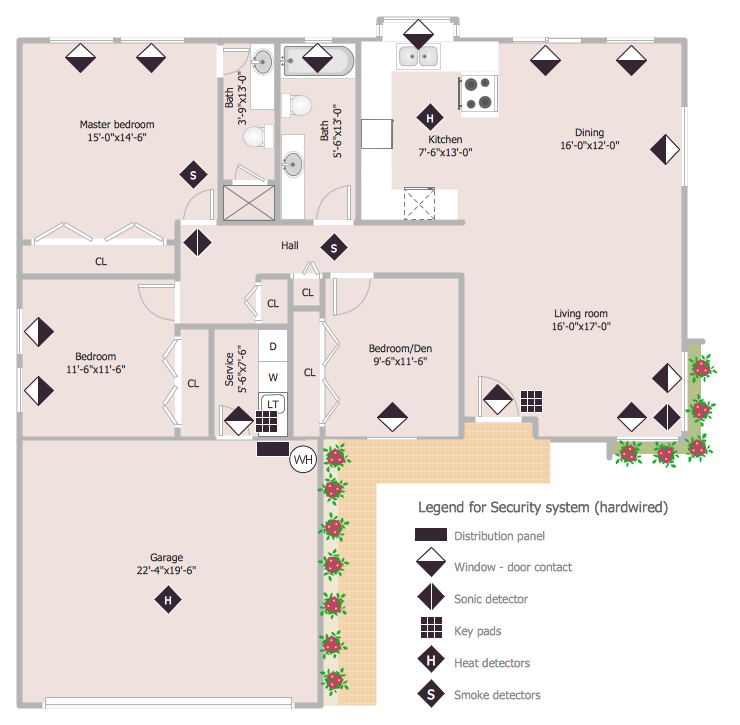
How to Draw a Security and Access Floor Plan
When you are dealing with floor plans for your office or home, it's good to have a security and access plan as well. Any equipment that is responsible for certain aspects of security can be incorporated into a security and access floor plan. Any equipment that is responsible for certain aspects of security can be incorporated into a security and access floor plan. Ability to create a security and access plan in ConceptDraw DIAGRAM is contained in the Security and Access Plans solution. You can use ConceptDraw DIAGRAM to make the security and access plans for your office simple, accurate and easy-to-read.HelpDesk
How to Create an Accounting Flowchart
An Accounting flowchart is a specialized type of flowchart. With the help of an accounting flowchart, you can visually describe tasks, documents, people responsible for execution at each stage of the accounting workflow. Find out how you can easily create an accounting flowchart of any complexity using Accounting Flowchart Solution from the ConceptDraw Solution Park.HelpDesk
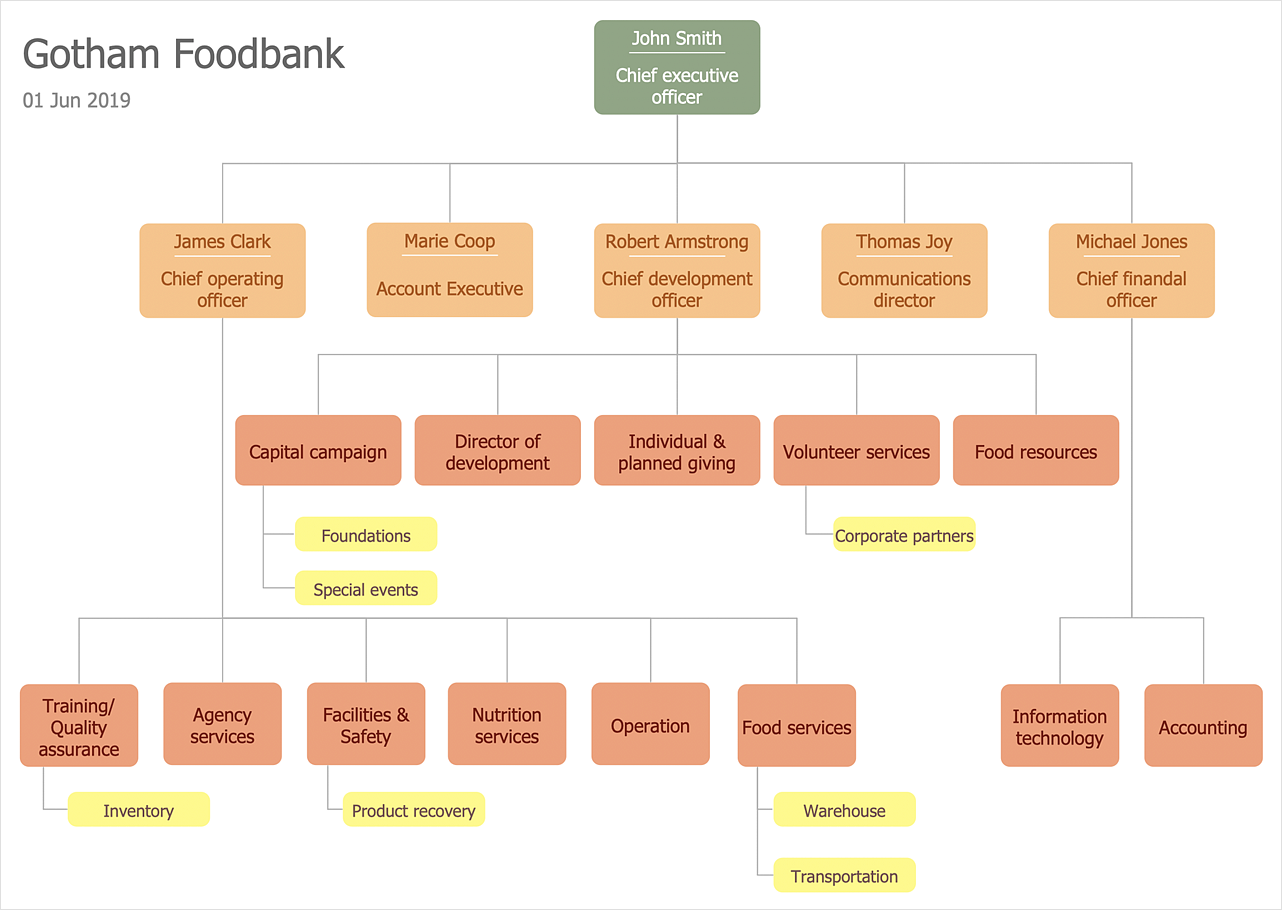
How to Draw an Organizational Chart
Polish your diagram appearance using the tools provided in the Format panel. The organizational chart software is a valuable tool for modern business. It is important for any business to build a clear organizational structure that determines the responsibilities and relationships between different positions in the organization. The clear structured organization - means the clear structured business workflow, which is the core of success in the business. ConceptDraw DIAGRAM is an org chart software that allows you to draw an organizational structure of your company quickly and easily.
 Sales Dashboard
Sales Dashboard solution extends ConceptDraw DIAGRAM software with templates, samples and library of vector stencils for drawing the visual dashboards of sale metrics and key performance indicators (KPI).
 Stakeholder Onion Diagrams
The Stakeholder Onion Diagram is often used as a way to view the relationships of stakeholders to a project goal. A basic Onion Diagram contains a rich information. It shows significance of stakeholders that will have has influence to the success achieve
HelpDesk
How to Create a Timeline Diagram
A Timeline is a chart which displays a project plan schedule in chronological order. A Timeline is used in project management to depict project milestones and visualize project phases and show project progress. The graphic form of a timeline makes it easy to understand critical project milestones, such as the progress of a project schedule. Timelines are particularly useful for project scheduling or project management when accompanied with a Gantt chart. It captures the main of what the project will accomplish and how it will be done. making a project timeline is one of the most important skills a project manager needs have. Making comprehensive, accurate timelines allows you getting every project off in the best way. ConceptDraw DIAGRAM allows you to draw a timeline chart using a special library.HelpDesk
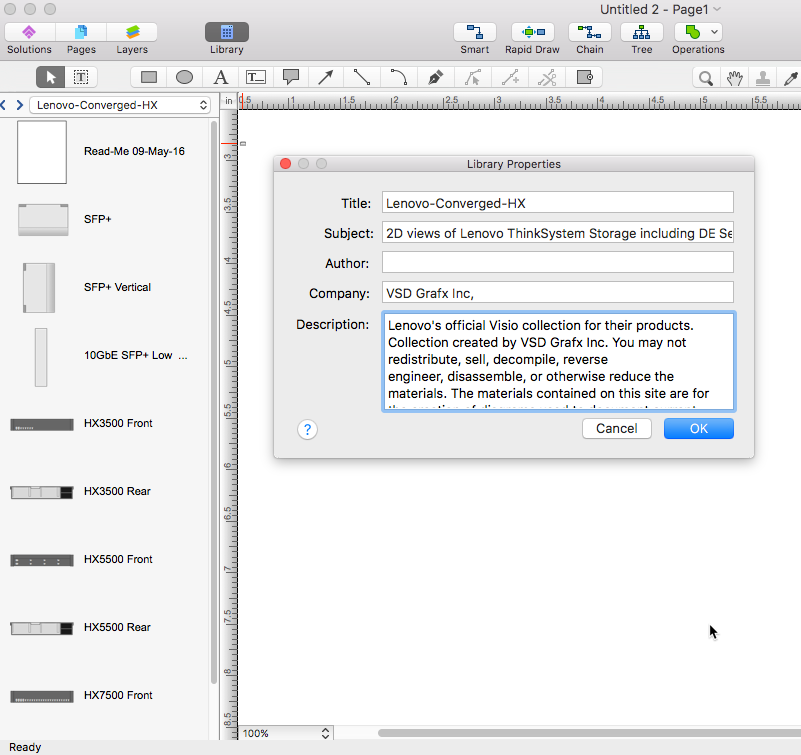
How to Convert MS Visio Custom Stencil to ConceptDraw DIAGRAM
Microsoft Visio allows users to create a new custom stencil to store objects that one want to reuse later or share it with other people. ConceptDraw DIAGRAM supports the possibility to open Visio custom stencils and shapes. With the introduction of Visio 2013 Microsoft has changed the native file format used in earlier versions of Microsoft Visio. Thus, when you are looking for professional tool to open and save in the newer Visio 2013 file format on Mac. ConceptDraw DIAGRAM is exactly solution for you.HelpDesk
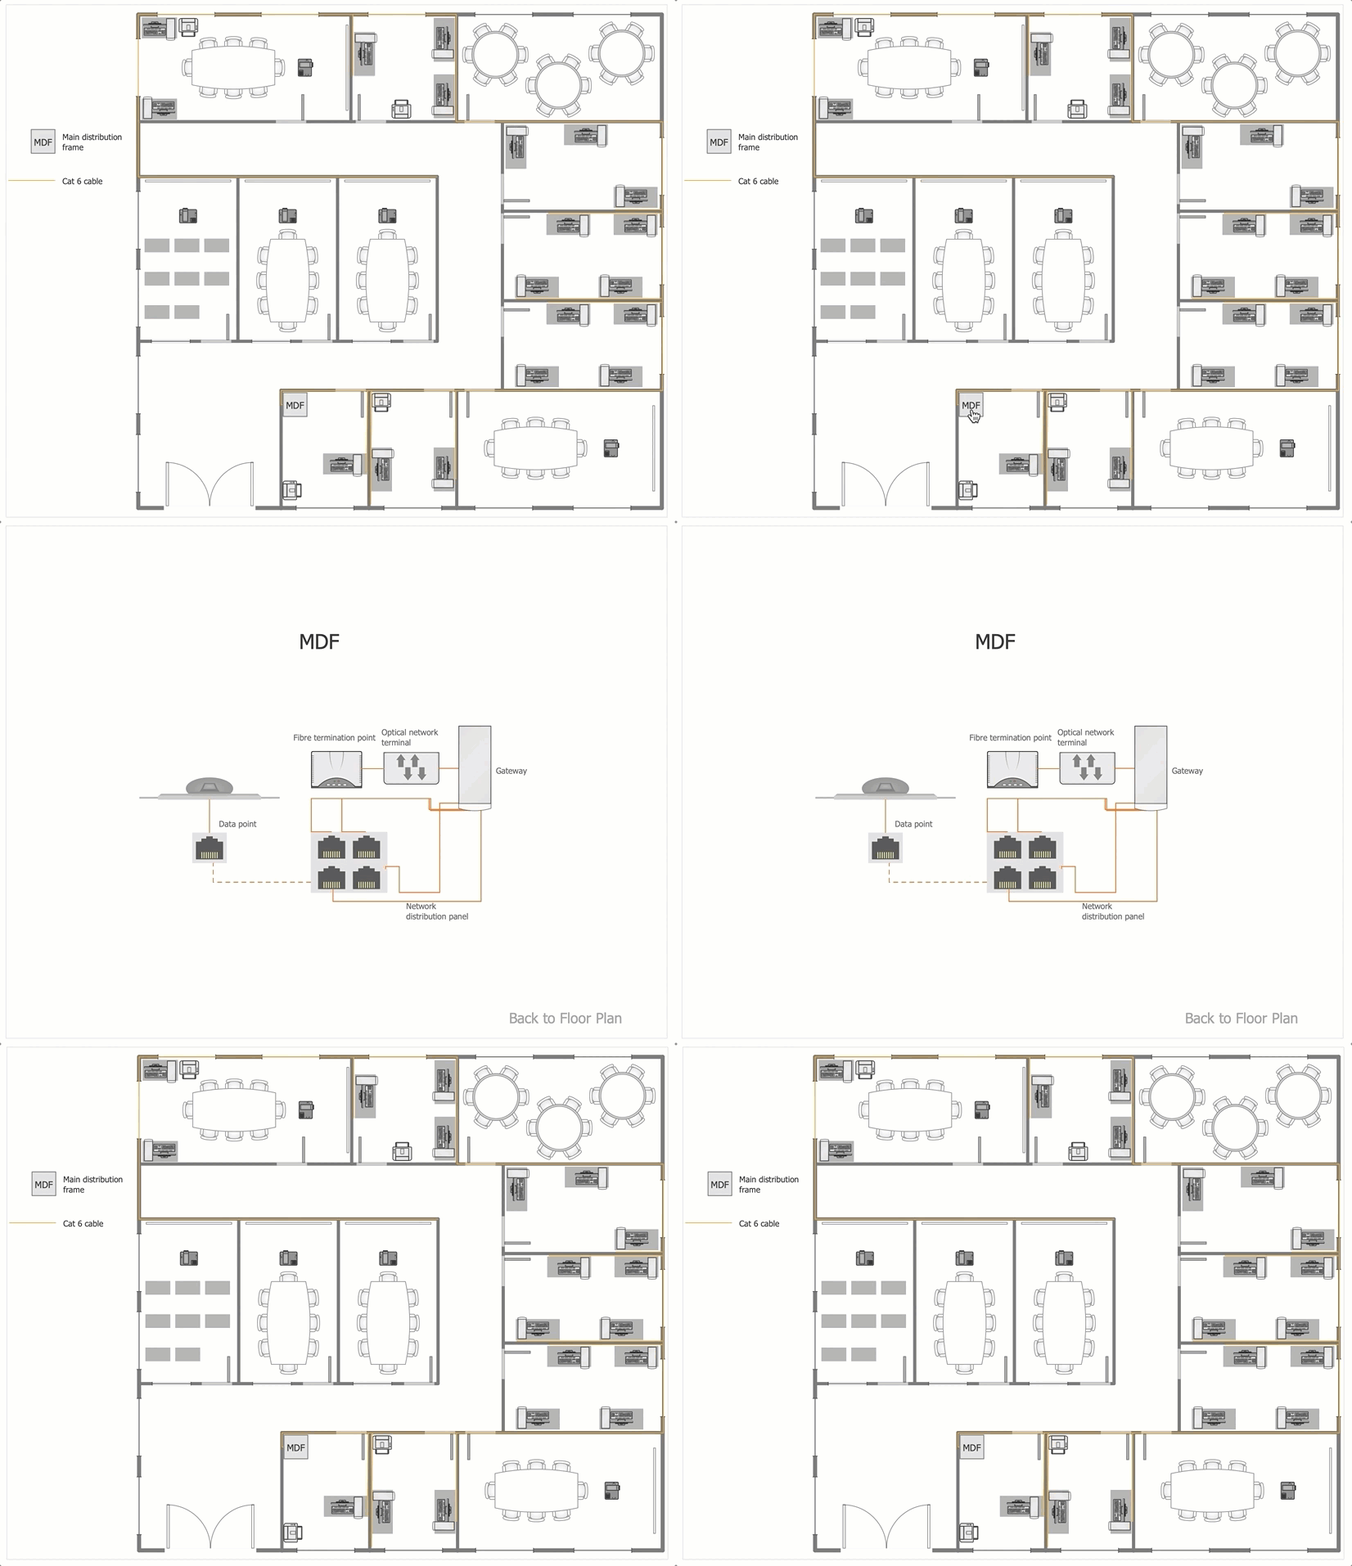
How to Create a Network Layout Floor Plan
With technology and market forces demanding ever quicker business response times, a well-structured computer network is the foundation of positive communication between employees, and with the wider world. When you walk into most modern work offices, there is a good chance you will be greeted by banks of computer screens and terminals, perhaps some sales points screens or server stacks, almost certainly routers and printers. A side effect of this amount of hardware is the amount of cabling necessary to connect these elements into an effective local area network (LAN). This is the idea behind a network layout plan - it can show how a network is connected, how data transfers between those connections, and give an overview of devices and hardware used in the office. To create a practical computer network floor plan, the network administrator must adhere to the specified requirements and limitations of the office or building in which the LAN will operate - things such as hardware availability,Business Diagram Software
When managing the projects, people, or networks, there are daily designed and used different types of Business diagrams, so the powerful drawing software will be very useful for this. ConceptDraw DIAGRAM with large quantity of business solutions will meet your needs and will help you convey your ideas successful and rapidly, no matter are you professional or beginner. It is the best choice for business specialists and technical professionals who need quickly and easily explore, visualize, and communicate information. ConceptDraw DIAGRAM business diagram software is the most powerful business software and relational charting software. Create advanced, completely customizable Business Process Diagrams, Business Flow Charts, Work Flow Diagrams, Organizational Charts, Audit diagrams, Marketing diagrams, Value Stream Maps, TQM diagrams, ERD diagrams, EPC diagrams, Cause and Effect diagrams, Infographics, Dashboards, and other Relational business diagrams from your data using the powerful drawing tools of ConceptDraw Solution Park.
- Website KPIs - Visual dashboard | Projects HR dashboard | PM ...
- Financial Dashboard By Department Examples
- The Facts and KPIs | KPIs and Metrics | KPI Dashboard | Kpis
- Sales metrics and KPIs - Visual dashboard | Website KPIs - Visual ...
- Website KPIs - Visual dashboard | A KPI Dashboard Provides the ...
- Sales department - Vector stencils library | Sales KPIs and Metrics ...
- Performance Indicators | Constant improvement of key performance ...
- Website KPIs - Visual dashboard | A KPI Dashboard | Sales KPIs ...
- Enterprise dashboard | Business and Finance | Audit Flowcharts ...
- Website KPIs - Visual dashboard | Area Charts | Sales Achievement ...
- Website traffic dashboard | Website metrics - Visual dashboard ...
- Performance Indicators | Design elements - Sales KPIs and metrics ...
- Enterprise dashboard | Business and Finance | How to Use ...
- Enterprise dashboard | KPI Dashboard | Business Graphics ...
- Virtuous circle (management) - Ring chart | Website KPIs - Visual ...
- KPIs and Metrics | Performance Indicators | Strategy Map | Metrics ...
- Sales Growth. Bar Graphs Example | Sales Dashboards for Your ...
- Performance Indicators | Website KPIs - Visual dashboard | How to ...
- Performance Indicators | What is a KPI ? | KPI Dashboard | Key ...
- A KPI Dashboard | A KPI Dashboard Provides the Answers Your ...


