Sales Growth. Bar Graphs Example

The vector stencils library "Currency" contains 28 currency and money icons.
Use it to design your business and finance illustrations and infographics with ConceptDraw PRO diagramming and vector drawing software.
The vector stencils library "Currency" is included in the Business and Finance solution from the Illustration area of ConceptDraw Solution Park.
Use it to design your business and finance illustrations and infographics with ConceptDraw PRO diagramming and vector drawing software.
The vector stencils library "Currency" is included in the Business and Finance solution from the Illustration area of ConceptDraw Solution Park.
Dollar

Euro

Pound

Yen

Dollar banknotes

Euro banknotes

Pound banknotes

Yen banknotes

Coins

Money bags

Money in jar

Credit cards

Money box

Financial transaction

Calculation

Budget measures

Financial growth

Cash register finance calculation

Electronic funds

Credit card payment

Cash payment

Donation

Cheque book

Invoice

Money management

Time is money

Estimate

Financial security

The vector clipart library "Presentation design elements" contains 45 presentation symbols and arrows which you can easy use in your slides and illustrations.
"A presentation is the process of presenting a topic to an audience. It is typically a demonstration, lecture, or speech meant to inform, persuade, or build good will. ... the use of visuals reduced meeting times... audiences believe presenters who use visuals are more professional and credible than presenters who merely speak. ... meetings and presentations reinforced with visuals help participants reach decisions and consensus more quickly." [Presentation. Wikipedia]
The clip art example "Presentation design elements - Vector clipart library" was created in the ConceptDraw PRO diagramming and vector drawing software using the Presentation Clipart solution from the Illustration area of ConceptDraw Solution Park.
Advance Direction Sign

Circuit

Growth

Master Link

Comparison

Plus

Minus

Multiplication

Division

Loupe

Plus sign

Minus sign

Pros and Cons

Balance Lever

Balance

Scientific Research

Business People

Hand

Financial Growth

Wallet

Increase

Decrease

Clock

Mechanism

Interaction

Small Company

Big Company

Company Expansion

Foreign Market Entry

Time

Close Cooperation

Company

Company Merger

Company Extension

Foreign Market Penetration

Business Relations

Profits

Frame 1

Frame 2

Background 1

Background 2

Background 3

Background 4

Background 5

Title block

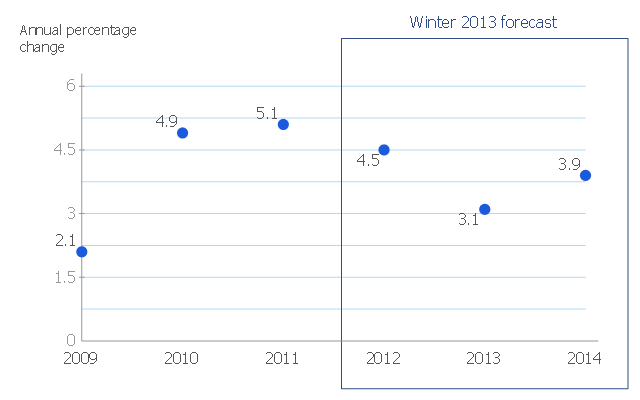
This scatter chart sample shows the MENA's (Middle East and North Africa's) real GDP growth. It was designed on the base scatter graph from the website of the European Economic Forecast (EUROPEAN ECONOMY 1|2013, Economic and Financial Affairs Winter 2013, European Commission). [ec.europa.eu/ economy_ finance/ publications/ european_ economy/ 2013/ pdf/ ee1_ en.pdf]
"The term MENA, for "Middle East and North Africa", is an acronym often used in academic, military planning, disaster relief, and business writing.
Due to the geographic ambiguity and Eurocentric nature of the term "Middle East", many people prefer use of the term WANA (West Asia and North Africa) or the less common NAWA (North Africa-West Asia).
The term covers an extensive region, extending from Morocco to Iran, including the majority of both the Middle Eastern and Maghreb countries. The term is roughly synonymous with the term the Greater Middle East. ...
MENA has no standardized definition; different organizations define the region as consisting of different territories. The following is a list of commonly included countries and territories: Bahrain, Egypt, Iran, Iraq, Israel, Jordan, Kuwait, Lebanon, Yemen, United Arab Emirates, Libya, Morocco, Oman, West Bank and Gaza, Qatar, Saudi Arabia, Syria, Tunisia, Algeria.
Sometimes also included in broader definitions: Armenia, Azerbaijan, Cyprus, Djibouti, Mauritania, Somalia, Sudan, Turkey, Western Sahara." [MENA. Wikipedia]
The scatter chart example "Middle East and North Africa's real GDP growth" was created using the ConceptDraw PRO diagramming and vector drawing software extended with the Line Graphs solution from the Graphs and Charts area of ConceptDraw Solution Park.
Scatter graph
The vector clipart library "Presentation design elements" contains 45 presentation symbols and arrows which you can easy use in your slides and illustrations.
"A presentation is the process of presenting a topic to an audience. It is typically a demonstration, lecture, or speech meant to inform, persuade, or build good will. ... the use of visuals reduced meeting times... audiences believe presenters who use visuals are more professional and credible than presenters who merely speak. ... meetings and presentations reinforced with visuals help participants reach decisions and consensus more quickly." [Presentation. Wikipedia]
The clip art example "Presentation design elements - Vector clipart library" was created in the ConceptDraw PRO diagramming and vector drawing software using the Presentation Clipart solution from the Illustration area of ConceptDraw Solution Park.
"A presentation is the process of presenting a topic to an audience. It is typically a demonstration, lecture, or speech meant to inform, persuade, or build good will. ... the use of visuals reduced meeting times... audiences believe presenters who use visuals are more professional and credible than presenters who merely speak. ... meetings and presentations reinforced with visuals help participants reach decisions and consensus more quickly." [Presentation. Wikipedia]
The clip art example "Presentation design elements - Vector clipart library" was created in the ConceptDraw PRO diagramming and vector drawing software using the Presentation Clipart solution from the Illustration area of ConceptDraw Solution Park.
Advance Direction Sign
Circuit
Growth
Master Link
Comparison
Plus
Minus
Multiplication
Division
Loupe
Plus sign
Minus sign
Pros and Cons
Balance Lever
Balance
Scientific Research
Business People
Hand
Financial Growth
Wallet
Increase
Decrease
Clock
Mechanism
Interaction
Small Company
Big Company
Company Expansion
Foreign Market Entry
Time
Close Cooperation
Company
Company Merger
Company Extension
Foreign Market Penetration
Business Relations
Profits
Frame 1
Frame 2
Background 1
Background 2
Background 3
Background 4
Background 5
Title block
Rainfall Bar Chart

Computer Hardware - Reseller Business Plan

Mind Maps for Business - SWOT Analysis

Basketball Defense Drills

Diversification is a corporate strategy to increase sales volume from new products and new markets. Diversification can be expanding into a new segment of an industry that the business is already in, or investing in a promising business outside of the scope of the existing business.
Diversification is part of the four main growth strategies defined by Igor Ansoff's Product/ Market matrix.
Ansoff pointed out that a diversification strategy stands apart from the other three strategies. The first three strategies are usually pursued with the same technical, financial, and merchandising resources used for the original product line, whereas diversification usually requires a company to acquire new skills, new techniques and new facilities. [Diversification (marketing strategy). Wikipedia]
This Ansoff's Product/ Market matrix example was created using ConceptDraw PRO diagramming and vector drawing software extended with Matrices solution from Marketing area of ConceptDraw Solution Park.
Ansoff matrix

Business Tools Perceptual Mapping

Bar Graph

- Vector Growth Png
- Vector Png Of Finance
- Plus And Minus Sign Png Firm Cartoon
- Business Growth Icon Png
- Design Elements Vector Clipart Png
- Cash Vector Png
- Clipart Background Designs Png
- Business People Vector Png
- Vector Backgrounds Png
- Presentation Vector Png
- Design For Title Png
- Lever Png
- People Clipart Png
- Bar Diagrams for Problem Solving. Create economics and financial ...
- People Elements Png
- Bar Diagrams for Problem Solving. Create economics and financial ...
- Png Clip Art
- Red Plus Png
- Wedding People Clipart Png
- Discussion People Png