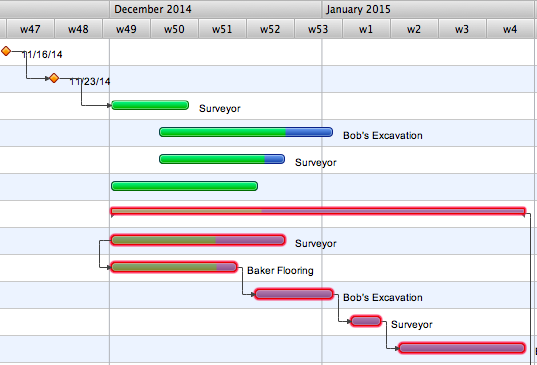
How to Discover Critical Path on a Gantt Chart
ConceptDraw PROJECT is the Gantt chart software that implements critical path method to provide the user with a wide set of project management tools.HelpDesk
How to Use Critical Path Analysis for Scheduling Complex Projects
Instruction on how to use this important project management tool with ConceptDraw PROJECTCause and Effect Analysis
Cause and Effect Analysis - The Seven Management and Planning Tools is a tool for Cause and Effect Analysis that allows users to analyze the root causes for factors that influenced the problem. This diagram is constructed separately for each highly prioritized factor. The Diagram is then used for further formulation of potential actions.
Process Flowchart
The main reason of using Process Flowchart or PFD is to show relations between major parts of the system. Process Flowcharts are used in process engineering and chemical industry where there is a requirement of depicting relationships between major components only and not include minor parts. Process Flowcharts for single unit or multiple units differ in their structure and implementation. ConceptDraw PRO is Professional business process mapping software for making Process flowcharts, Process flow diagram, Workflow diagram, flowcharts and technical illustrations for business documents and also comprehensive visio for mac application. Easier define and document basic work and data flows, financial, production and quality management processes to increase efficiency of your business with ConcepDraw PRO. Business process mapping software with Flowchart Maker ConceptDraw PRO includes extensive drawing tools, rich examples and templates, process flowchart symbols and shape libraries, smart connectors that allow you create the flowcharts of complex processes, process flow diagrams, procedures and information exchange. Process Flowchart Solution is project management workflow tools which is part ConceptDraw Project marketing project management software. Drawing charts, diagrams, and network layouts has long been the monopoly of Microsoft Visio, making Mac users to struggle when needing such visio alternative like visio for mac, it requires only to view features, make a minor edit to, or print a diagram or chart. Thankfully to MS Visio alternative like ConceptDraw PRO software, this is cross-platform charting and business process management tool, now visio alternative for making sort of visio diagram is not a problem anymore however many people still name it business process visio tools.
SWOT analysis matrix diagram templates
SWOT analysis or SWOT Matrix is a structured method of the planning which is used to evaluate the S - Strengths, W - Weaknesses, O - Opportunities, and T - Threats involved in a business project or commercial venture. It was introduced at 1960s as a tool for learning the internal capabilities of large companies. A SWOT analysis includes the indication of the project's goal, specification the critical factors (internal and external) that influence on the achievement of company's business goal, that are conducive or adverse for this. SWOT analysis is effective way to successful business, to win in rivalry with competitors and become the best on your market. SWOT Analysis solution from Management area of ConceptDraw Solution Park makes the ConceptDraw PRO a powerful SWOT and TOWS analysis software. It contains a lot of vector design elements of SWOT and TOWS matrices, numerous examples and templates. The predesigned SWOT example or template is a fastest way of drawing professional-looking SWOT Matrix and presenting analysis results in just one click.Collaboration in a Project Team
Create with our data flow diagram software perfect data flow diagrams. Download data flow diagram software for FREE. Use hundreds of data flow diagram examples.Competitor Analysis
Competitor analysis is a first and obligatory step in elaboration the proper corporate marketing strategy and creating sustainable competitive advantage. Use powerful opportunities of numerous solutions from ConceptDraw Solution Park for designing illustrative diagrams, charts, matrices which are necessary for effective competitor analysis.- Program Evaluation and Review Technique (PERT) with ...
- Activity Network (PERT) Chart | Examples of Flowcharts, Org Charts ...
- Matrix Diagram For Finding Root Causes
- Project planning process - Flowchart | How to Create Flowchart ...
- Accident analytic tree - FTA diagram | ConceptDraw Solution Park ...
- Decision Making | Cause and Effect Analysis | PROBLEM ...
- UML Class Diagram Example - Apartment Plan | Local area network ...
- PROBLEM ANALYSIS. Root Cause Analysis Tree Diagram | Person ...
- Problem solving | Fishbone Diagram Problem Solving | Using ...


