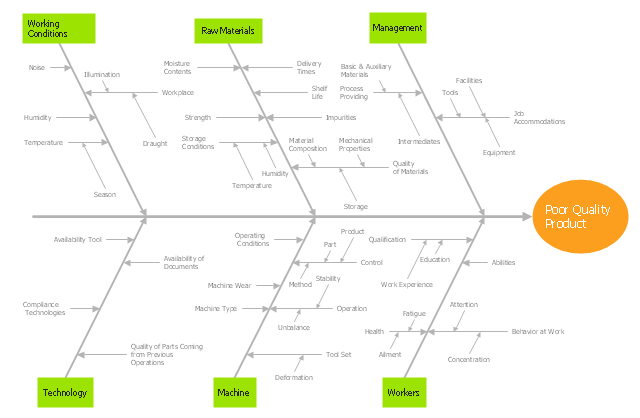
"Ishikawa diagrams (also called fishbone diagrams, herringbone diagrams, cause-and-effect diagrams, or Fishikawa) are causal diagrams created by Kaoru Ishikawa (1968) that show the causes of a specific event. Common uses of the Ishikawa diagram are product design and quality defect prevention, to identify potential factors causing an overall effect. Each cause or reason for imperfection is a source of variation. Causes are usually grouped into major categories to identify these sources of variation. The categories typically include:
- People: Anyone involved with the process
- Methods: How the process is performed and the specific requirements for doing it, such as policies, procedures, rules, regulations and laws
- Machines: Any equipment, computers, tools, etc. required to accomplish the job
- Materials: Raw materials, parts, pens, paper, etc. used to produce the final product
- Measurements: Data generated from the process that are used to evaluate its quality
- Environment: The conditions, such as location, time, temperature, and culture in which the process operates" [Ishikawa diagram. Wikipedia]
The fishbone diagram example "Causes of low-quality output" was created using the ConceptDraw PRO diagramming and vector drawing software extended with the Fishbone Diagrams solution from the Management area of ConceptDraw Solution Park.
Create Fishbone Diagrams
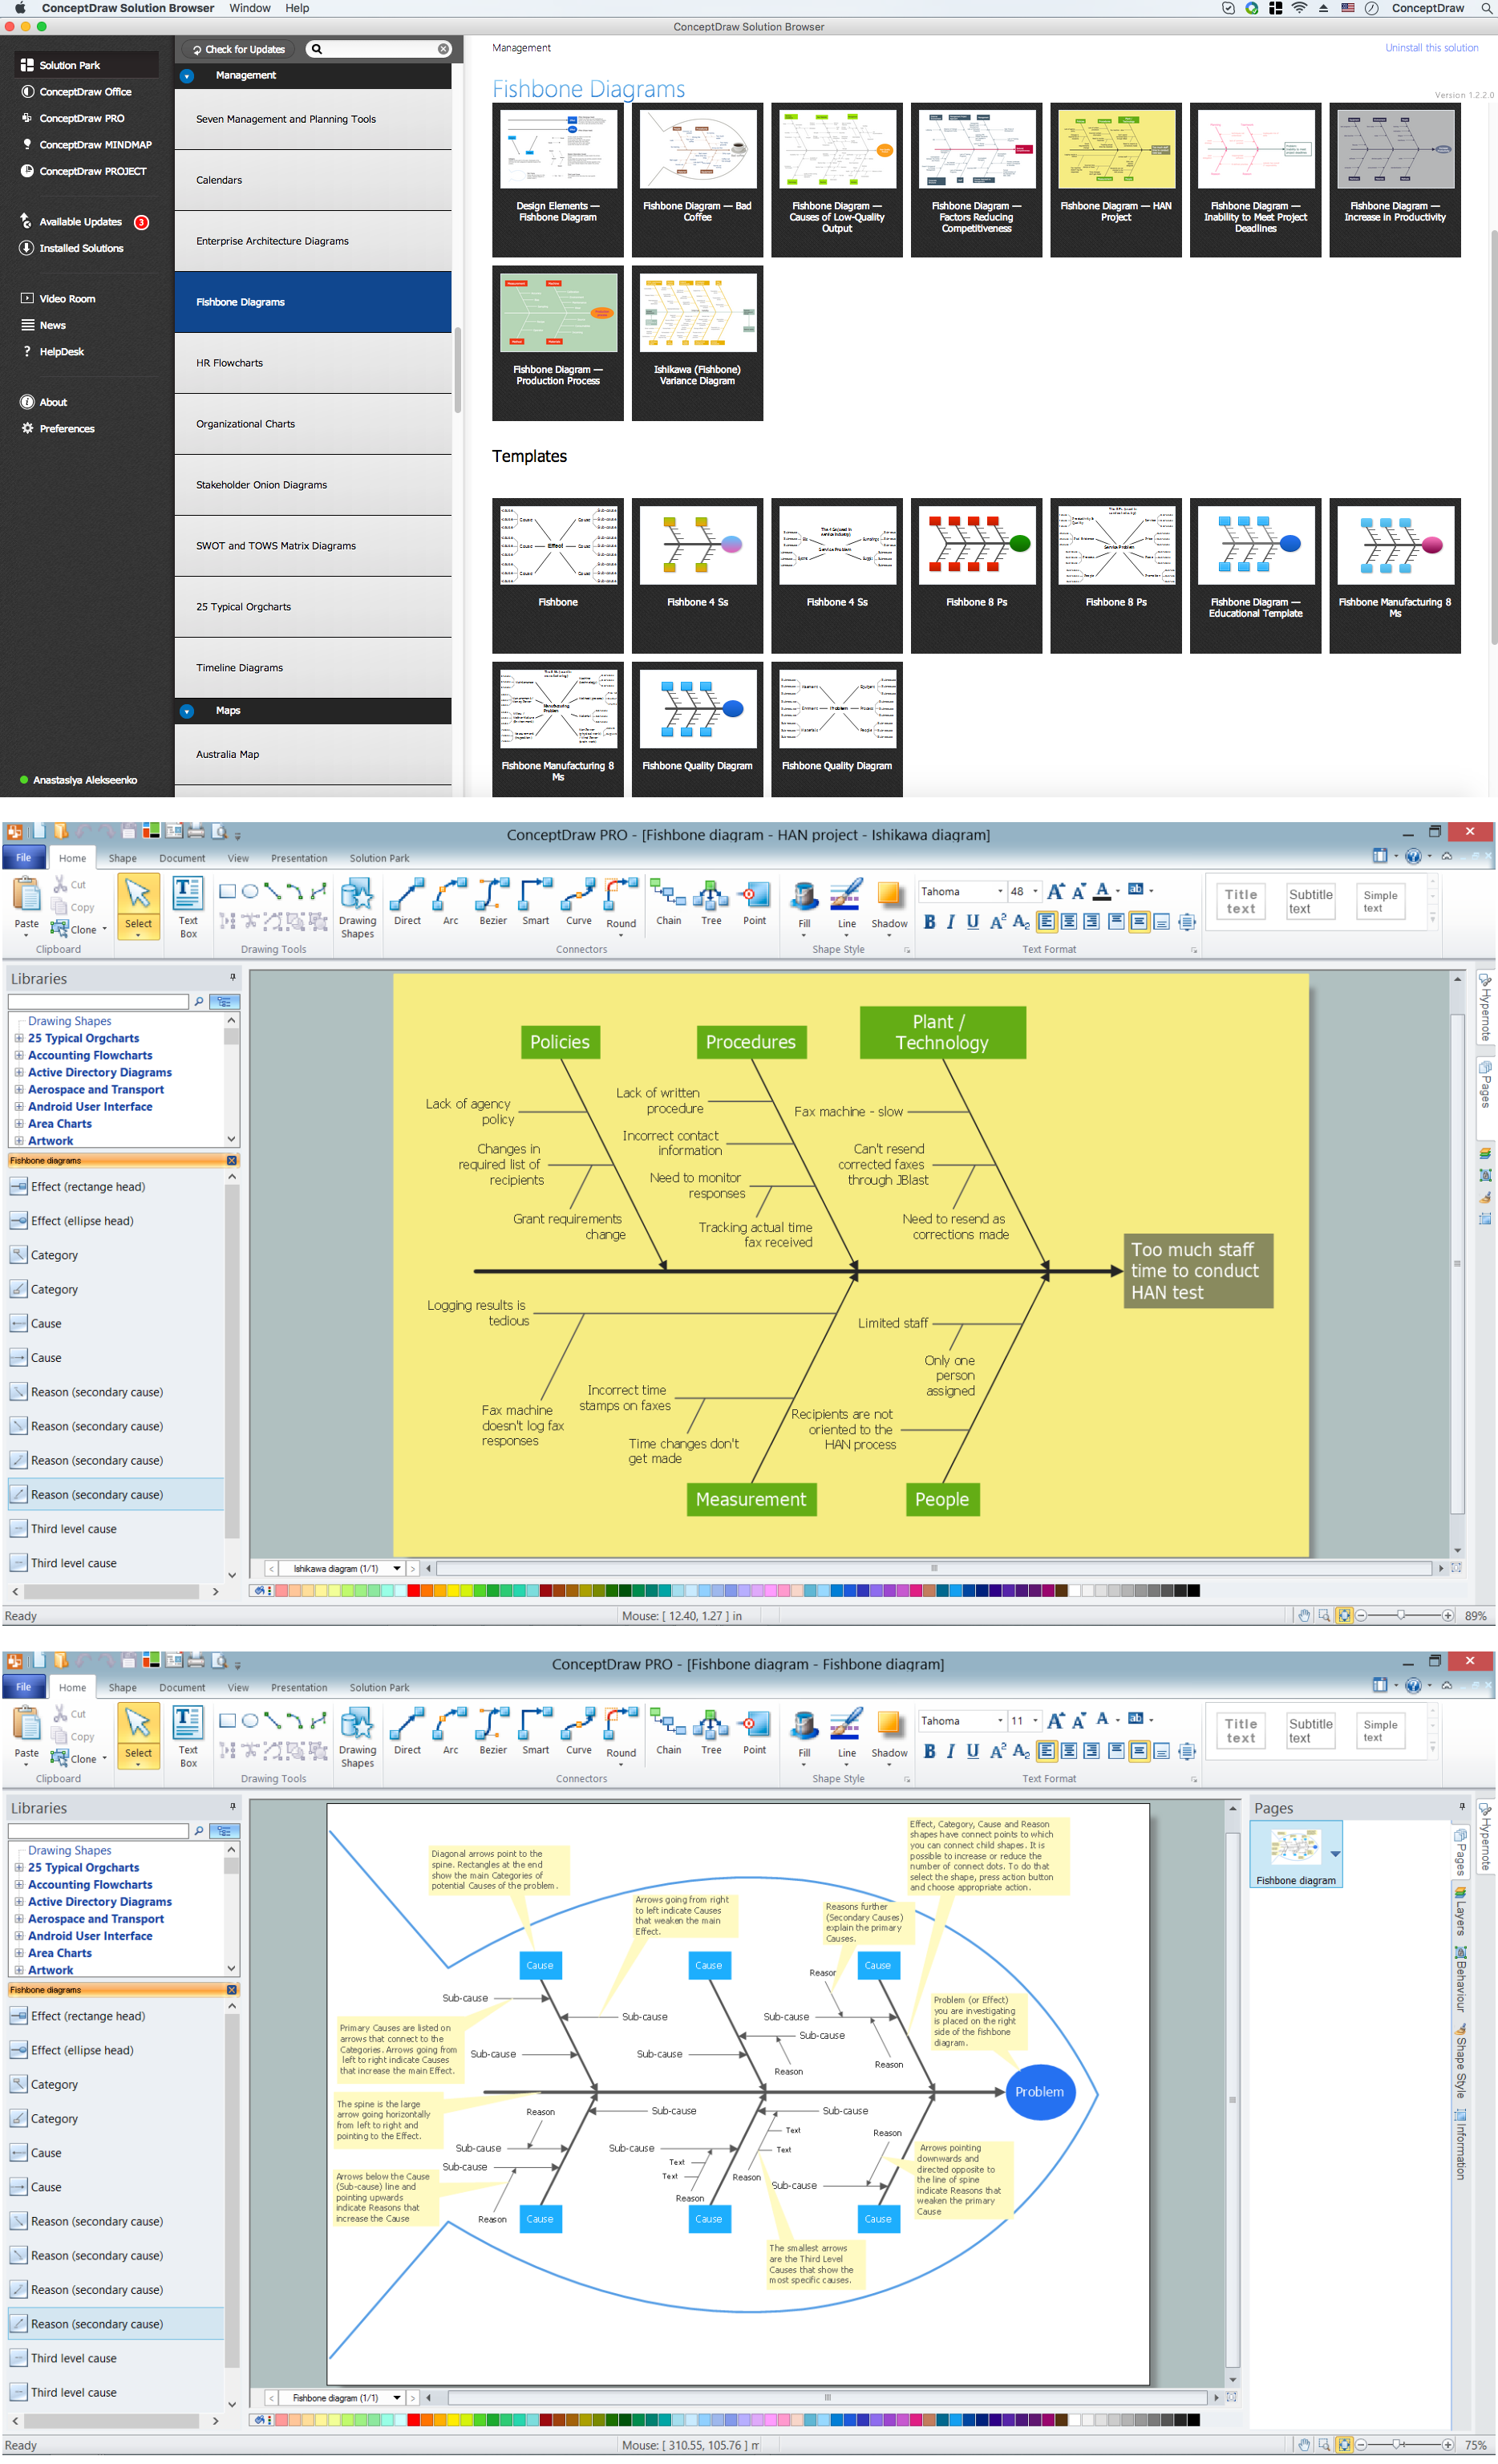
Common uses of the Fishbone (Ishikawa) diagrams are product design and quality defect prevention. They are effectively used to identify potential factors causing an overall effect for making possibility to solve a problem. To create Fishbone Diagrams, Cause-and-Effect Diagrams, Ishikawa Diagrams, we recommend to use a ConceptDraw DIAGRAM software enhanced with Fishbone Diagrams solution from the Management area of ConceptDraw Solution Park.Total Quality Management Business Diagram
The Total Quality Management Diagram solution helps you and your organization visualize business and industrial processes. Create Total Quality Management diagrams for business process with ConceptDraw software.Seven Basic Tools of Quality - Fishbone Diagram
ConceptDraw DIAGRAM enhanced with Seven Basic Tools of Quality solution from the Quality area of ConceptDraw Solution Park is an ideal software for fast and easy drawing professional looking quality diagrams, including a Fishbone diagram.Draw Fishbone Diagram on MAC Software
The problem solving and decision-making processes are closely linked and crucial for the business and life. There are many tools and techniques for facilitating and improvement these processes, and also enhancement the quality of accepted decisions. One of them is Fisbone Diagram or Cause and Effect diagram. For its construction, you need first define the problem which you need to solve (existing or potential), write it into rectangular and draw to it a horizontal line - a “fish spine”. Then define general types of possible causes like Persons, Materials, Methods, Machinery, Measurements or Environment, and attach them to “spine”. Start brainstorming the possible reasons of failure and connect them to the branches. Professional diagramming ConceptDraw DIAGRAM MAC OSX software offers the Fishbone Diagrams solution which contains templates, samples, and ready Fishbone design objects. Use of them lets effectively identify the possible causes for an effect, realize successfully cause and effect analysis, and instantly draw Fishbone diagram on Mac software."Common uses of the Ishikawa diagram are product design and quality defect prevention, to identify potential factors causing an overall effect. Each cause or reason for imperfection is a source of variation. Causes are usually grouped into major categories to identify these sources of variation. The categories typically include:
(1) People: Anyone involved with the process;
(2) Methods: How the process is performed and the specific requirements for doing it, such as policies, procedures, rules, regulations and laws;
(3) Machines: Any equipment, computers, tools, etc. required to accomplish the job;
(4) Materials: Raw materials, parts, pens, paper, etc. used to produce the final product;
(5) Measurements: Data generated from the process that are used to evaluate its quality;
(6) Environment: The conditions, such as location, time, temperature, and culture in which the process operates. ...
Ishikawa diagrams were popularized by Kaoru Ishikawa in the 1960s, who pioneered quality management processes in the Kawasaki shipyards, and in the process became one of the founding fathers of modern management.
The basic concept was first used in the 1920s, and is considered one of the seven basic tools of quality control." [Ishikawa diagram. Wikipedia]
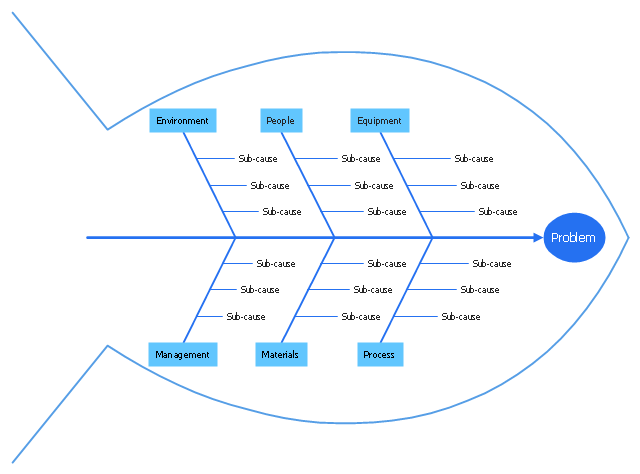
This quality Ishikawa diagram (cause and effect diagram) template is included in the Fishbone Diagram solution from the Management area of ConceptDraw Solution Park.
 Seven Basic Tools of Quality
Manage quality control in the workplace, using fishbone diagrams, flowcharts, Pareto charts and histograms, provided by the Seven Basic Tools of Quality solution.
Cause and Effect Analysis - Fishbone Diagrams for Problem Solving
Fishbone diagram is a powerful tool used for solving business problems and obstacles. ConceptDraw DIAGRAM software extended with Fishbone Diagrams solution from the Management area of ConceptDraw Solution Park is a helpful tool for cause and effect analysis. It gives the ability to easy identify many possible causes and factors which cause the effects and to draw Fishbone Diagrams for problem solving.How Do Fishbone Diagrams Solve Manufacturing Problems
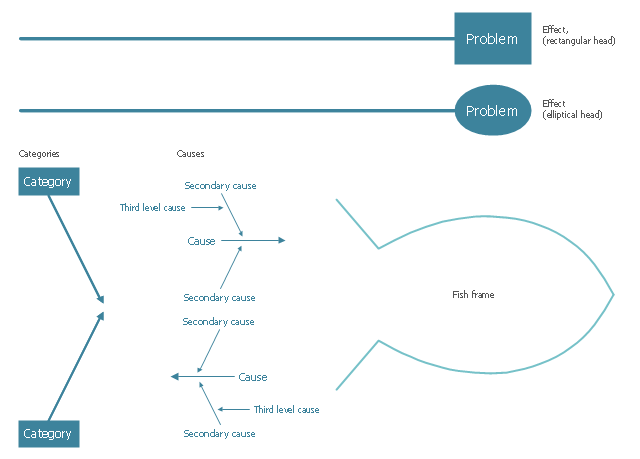
How do Fishbone diagrams solve manufacturing problems? Fishbone diagrams are successfully used in various fields of industries and manufacturing to analyze the set of possible causes and their effects. Fishbone diagram provides a process to clearly define the “Effect” and then puts you to thinking about the possible causes, based on the categories of common problems in manufacturing. ConceptDraw DIAGRAM application extended with Fishbone Diagrams solution lets you construct Fishbone diagrams and represent globally recognized standards for manufacturing 6 Ms and 8 Ms.The vector stencils library "Cause-and-effect diagram" contains 13 elements of fishbone diagram.
Use it to design your Ishikawa diagrams with ConceptDraw PRO diagramming and vector drawing software.
"Ishikawa diagrams (also called fishbone diagrams, herringbone diagrams, cause-and-effect diagrams, or Fishikawa) are causal diagrams created by Kaoru Ishikawa (1968) that show the causes of a specific event. Common uses of the Ishikawa diagram are product design and quality defect prevention to identify potential factors causing an overall effect. Each cause or reason for imperfection is a source of variation. Causes are usually grouped into major categories to identify these sources of variation. ...
The basic concept was first used in the 1920s, and is considered one of the seven basic tools of quality control." [Ishikawa diagram. Wikipedia]
The example of fishbone diagram shapes "Design elements - Cause-and-effect diagram" is included in the Seven Basic Tools of Quality solution from the Quality area of ConceptDraw Solution Park.
Total Quality Management Value
The Total quality management (TQM) is an enterprise-wide method of continuous quality improvement of all organizational processes, including the enhancement of ability to deliver high-quality products and services to the customers. The TQM includes eight main elements, which have great value: customer-focused, process-centered, total employee involvement, integrated system, continual improvement, strategic and systematic approach, fact-based decision making, communications. ConceptDraw DIAGRAM diagramming and vector drawing software offers the Total Quality Management Diagram solution with effective drawing tools, predesigned vector elements, samples and templates that help easy design the Total Quality Management diagrams, TQM flowcharts and Mind Maps widely used in quality management projects to visualize the business processes and industrial processes for your organization, to demonstrate the quality control step-by-step in a visual manner, to compare visually the ideal and real stages of processes.Improving Problem Solving and Focus with Fishbone Diagrams
When you need to focus on the problem, professional diagramming tool helps you create a Fishbone diagram also known as Ishikawa diagram. Understanding of the problem via Fishbone diagram will improve the processes between departments and teams. ConceptDraw DIAGRAM extended with Fishbone Diagrams solution gives a powerful tool for improving problem solving and focus with Fishbone diagrams.Fishbone Diagram Problem Solving
The Ishikawa diagram, Cause and Effect diagram, Fishbone diagram — all they are the names of one and the same visual method for working with causal connections. Originally invented by Kaoru Ishikawa to control the process quality, the Ishikawa diagram is well proven in other fields of management and personal scheduling, events planning, time management. It is a chart in the form of a fish, whose head is a problem, the fins are variants for its causes. To design easily the Fishbone diagram, you can use a special ConceptDraw DIAGRAM ector graphic and diagramming software which contains the powerful tools for Fishbone diagram problem solving offered by Fishbone Diagrams solution for the Management area of ConceptDraw Solution Park.Total Quality Management with ConceptDraw
Total Quality Management (TQM) system is the management method where the confidence in quality of all organization processes is placed foremost. The given method is widely used in production, in educational system, in government organizations and so on.Quality Control
Quality control can separate the act of testing different products for uncovering the defects from the decision in order to deny or allow any product release, which may be determined by different fiscal constraints. Quality control issues are known to be among the top reasons for not renewing the contracts and, thus, they have to be taken into consideration while working on some project.Ishikawa Diagram
In almost every sphere of life and work the people time to time are faced with the fact that on their way there are certain obstacles and problems. But it is not always possible to identify the true cause of particular problem. To understand the basic causes of problems and eliminate them, it is convenient to use the chart of Kaoru Ishikawa - the technique specially designed for this. ConceptDraw DIAGRAM diagramming and vector drawing software extended with Fishbone Diagrams solution from the Management area can help you with construction the Fishbone Diagram also known as Ishikawa Diagram. Ishikawa Diagram shows factors of Equipment, Process, People, Materials, Environment and Management, all affecting the overall problem in one drawing for the further analysis. It is a well effective way to analyze the business problems you must identify and solve.Quality meeting
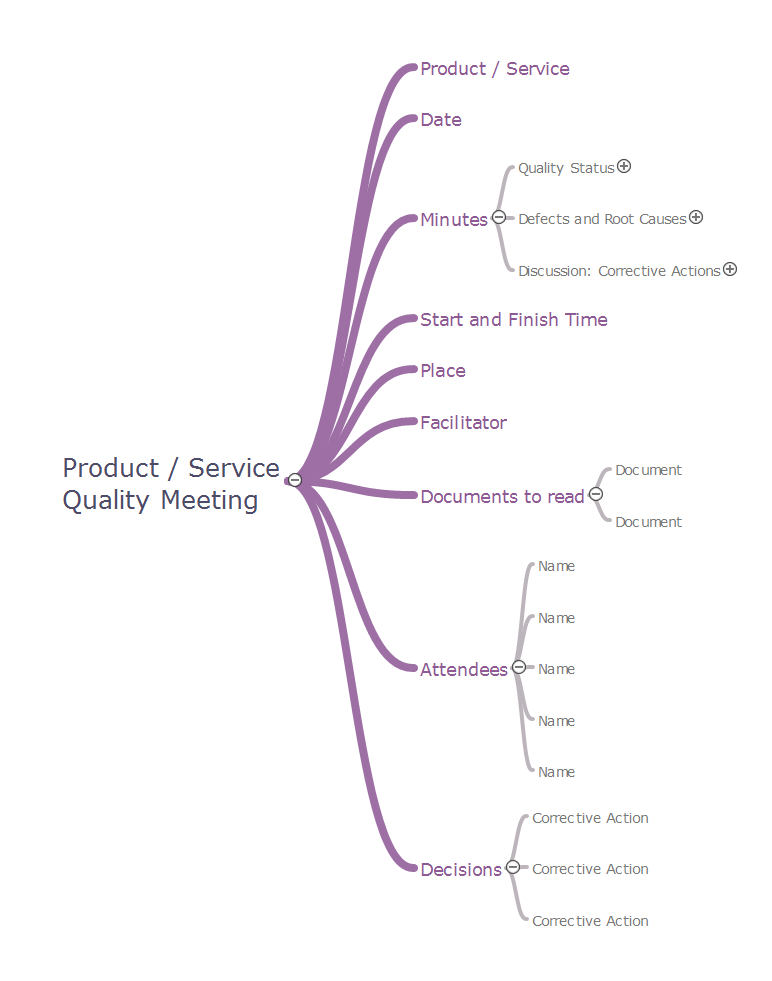
ConceptDraw MINDMAP software and solutions from the Quality Management Area of ConceptDraw Solution Park support the quality specialists, quality managers and manufacturing managers with powerful mind mapping and visualization tools for quality control and improvement in production field and other spheres. The quality management is a progressive field of activity nowadays and that's why such software is much opportunely. Due to the Quality solutions, you have now the ConceptDraw MINDMAP software with expanded abilities and can design Quality Mind Maps, Quality diagrams, Quality meeting documents in minutes. You have a lot of samples of Quality Management Mind Maps represented at ConceptDraw STORE, samples of presentations, meeting agendas, examples of solving different problems, etc. You also have an access to large set of templates specially developed to provide you the highest level of convenience and speed in designing your own Mind Maps, use them to quickly prepare for quality meetings by simple filling the appropriate fields. Apply the ConceptDraw MINDMAP to make the notes during the meetings or to send a short summary to meeting participants in seconds.TQM Diagram Tool
The Total Quality Management Diagram solution helps you and your organization visualize business and industrial processes. Create Total Quality Management diagrams for business process with ConceptDraw software."Ishikawa diagrams (also called fishbone diagrams, herringbone diagrams, cause-and-effect diagrams, or Fishikawa) are causal diagrams created by Kaoru Ishikawa (1968) that show the causes of a specific event. Common uses of the Ishikawa diagram are product design and quality defect prevention, to identify potential factors causing an overall effect. Each cause or reason for imperfection is a source of variation. Causes are usually grouped into major categories to identify these sources of variation. The categories typically include:
- People: Anyone involved with the process
- Methods: How the process is performed and the specific requirements for doing it, such as policies, procedures, rules, regulations and laws
- Machines: Any equipment, computers, tools, etc. required to accomplish the job
- Materials: Raw materials, parts, pens, paper, etc. used to produce the final product
- Measurements: Data generated from the process that are used to evaluate its quality
- Environment: The conditions, such as location, time, temperature, and culture in which the process operates" [Ishikawa diagram. Wikipedia]
The fishbone diagram example "Causes of low-quality output" was created using the ConceptDraw PRO diagramming and vector drawing software extended with the Fishbone Diagrams solution from the Management area of ConceptDraw Solution Park.
- Fishbone Diagram For Defective Products
- Fishbone diagram - Causes of low-quality output | Quality fishbone ...
- Fishbone Diagram Poor Quality Of Product
- Fishbone diagram - Causes of low-quality output | Fishbone ...
- New Fishbone Diagram Solution for ConceptDraw PRO v9
- Fishbone Diagram Sample Low Quality Products
- Fishbone Diagram | Fishbone Diagrams | Fish Borne Model Tqm
- Fishbone diagram - Causes of low-quality output | TQM Diagram ...
- Service 8 Ps fishbone diagram - Template | Fishbone Diagrams ...
- Fishbone Diagrams | Total Quality Management with ConceptDraw ...
- Service 8 Ps fishbone diagram - Template | Fishbone Diagram ...
- TQM Diagram Tool | Fishbone diagram - Causes of low-quality ...
- Design elements - Cause-and-effect diagram | Ishikawa fishbone ...
- How Do Fishbone Diagrams Solve Manufacturing Problems ...
- Total Quality Management with ConceptDraw | Fishbone diagram ...
- How Do Fishbone Diagrams Solve Manufacturing Problems | Cause ...
- Ishikawa fishbone diagram | Fishbone diagram - Bad coffee | Cause ...
- Cause and effect diagram - Increase in productivity | Fishbone ...
- Service 8 Ps fishbone diagram - Template | Fishbone Diagram ...
