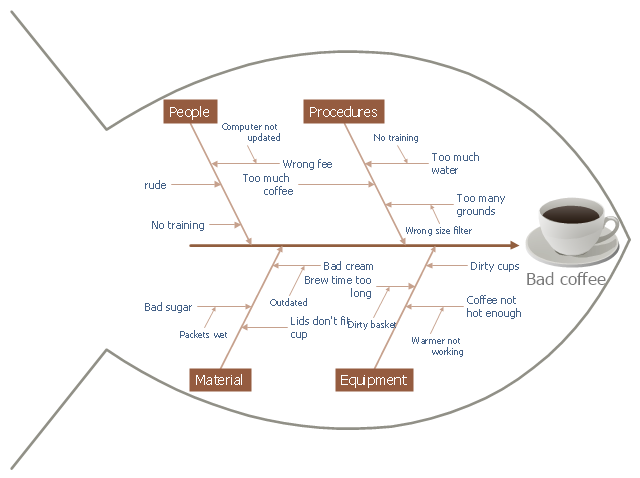
This cause and effect diagram sample was redesigned from the Wikimedia Commons file: Fishbone BadCoffeeExample.jpg. [commons.wikimedia.org/ wiki/ File:Fishbone_ BadCoffeeExample.jpg]
This file is licensed under the Creative Commons Attribution-Share Alike 3.0 Unported license. [creativecommons.org/ licenses/ by-sa/ 3.0/ deed.en]
The fishbone diagram example "Bad coffee" was created using the ConceptDraw PRO diagramming and vector drawing software extended with the Fishbone Diagrams solution from the Management area of ConceptDraw Solution Park.
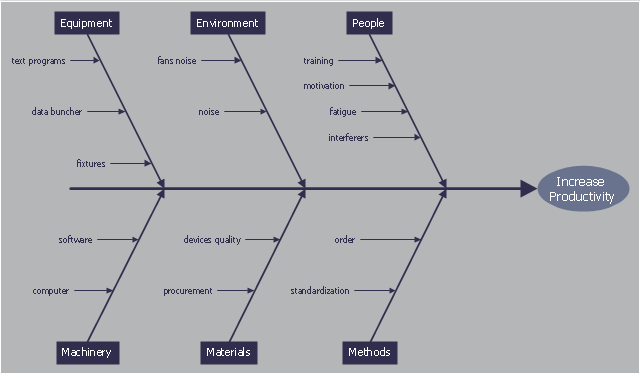
This cause and effect diagram sample was redesigned from the Wikimedia Commons file: Ursache Wirkung Diagramm Beispiel.png. [commons.wikimedia.org/ wiki/ File:Ursache_ Wirkung_ Diagramm_ Beispiel.png]
This file is licensed under the Creative Commons Attribution-Share Alike 3.0 Unported license. [creativecommons.org/ licenses/ by-sa/ 3.0/ deed.en]
"Productivity is the ratio of output to inputs in production; it is an average measure of the efficiency of production. Efficiency of production means production’s capability to create incomes which is measured by the formula real output value minus real input value.
Productivity is a crucial factor in production performance of firms and nations. Increasing national productivity can raise living standards because more real income improves people's ability to purchase goods and services, enjoy leisure, improve housing and education and contribute to social and environmental programs. Productivity growth also helps businesses to be more profitable." [Productivity. Wikipedia]
The fishbone diagram example "Increase in productivity" was created using the ConceptDraw PRO diagramming and vector drawing software extended with the Fishbone Diagrams solution from the Management area of ConceptDraw Solution Park.
How To use House Electrical Plan Software
How we can conduct the electricity at house correctly without a plan? It is impossible. The House electrical diagram depicts locations of switches, outlets, dimmers and lights, and lets understand how you will connect them. But design of House Electrical Plan looks a complex task at a glance, which requires a lot of tools and special experience. But now all is simple with all-inclusive floor plan software - ConceptDraw PRO. As a house electrical plan software, the ConceptDraw PRO contains libraries with a large range of professional lighting and electrical symbols, ready-to-use electrical plans samples and examples, and built-in templates for creating great-looking Home floor electrical plans. It is a fastest way to draw Electrical circuit diagrams, Electrical wiring and Circuit schematics, Digital circuits, Electrical equipment, House electrical plans, Satellite television, Cable television, Home cinema, Closed-circuit television when are used the tools of Electric and Telecom Plans Solution from ConceptDraw Solution Park. Files created in Visio for Mac app can be easily imported to ConceptDraw PRO. Also you may import stencils and even libraries. Try for free an alternative to Visio that Apple users recommend.
- Fishbone diagram - Bad coffee | Fishbone Diagrams | Using ...
- Fishbone diagram - Bad coffee | Fishbone Diagrams | Fishbone ...
- Fishbone diagram
- Fishbone diagram - Bad coffee | Cause and effect diagram ...
- Ishikawa fishbone diagram | Fishbone diagram - Bad coffee | Cause ...
- Fishbone Diagram | Fishbone Diagrams | Manufacturing 8 Ms ...
- Cause and Effect Analysis - Fishbone Diagrams for Problem Solving ...
- Fishbone Diagram | Cause and Effect Diagram | Fishbone Diagram ...
- Fishbone Diagram | Draw Fishbone Diagram on MAC Software ...
- Fishbone Diagram | Fishbone Diagram Example | Fishbone ...
- Cause and Effect Diagram | Fishbone Diagram | Cause and Effect ...
- Fishbone Diagrams | Fishbone diagram - Bad coffee | Fishbone ...
- Fishbone Diagrams | Using Fishbone Diagrams for Problem Solving ...
- Fishbone diagram - Template | Design elements - Cause-and-effect ...
- Fishbone Diagrams | Fishbone Diagram | How to Draw a Fishbone ...
- Fishbone Diagram | Using Fishbone Diagrams for Problem Solving ...
- Fishbone Diagram | Cause and Effect Analysis - Fishbone Diagrams ...
- Draw Fishbone Diagram on MAC Software | Fishbone Diagrams ...
- Using Fishbone Diagrams for Problem Solving | Fishbone Diagram ...
- Fishbone diagram - Bad coffee | Total Quality Management with ...


