 Fishbone Diagram
Fishbone Diagrams solution extends ConceptDraw PRO software with templates, samples and library of vector stencils for drawing the Ishikawa diagrams for cause and effect analysis.
 Fault Tree Analysis Diagrams
This solution extends ConceptDraw PRO v9.5 or later with templates, fault tree analysis example, samples and a library of vector design elements for drawing FTA diagrams (or negative analytical trees), cause and effect diagrams and fault tree diagrams.
 Fishbone Diagrams
The Fishbone Diagrams solution extends ConceptDraw PRO v10 software with the ability to easily draw the Fishbone Diagrams (Ishikawa Diagrams) to clearly see the cause and effect analysis and also problem solving. The vector graphic diagrams produced using this solution can be used in whitepapers, presentations, datasheets, posters, and published technical material.
HelpDesk
How to Create a Fishbone (Ishikawa) Diagram Quickly
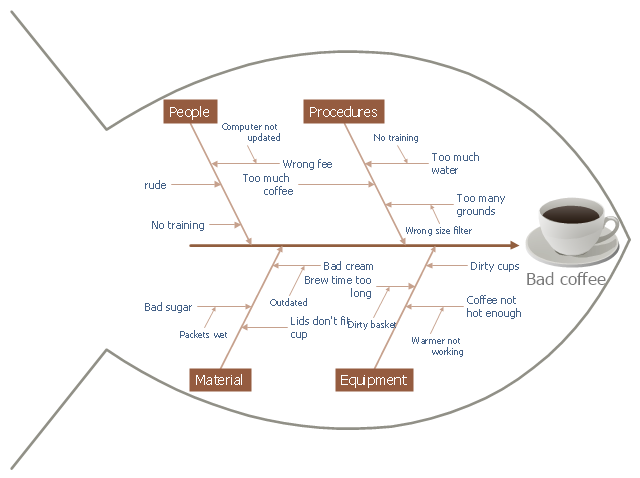
A Fishbone (Ishikawa) diagram is also called cause-and-effect diagram. Fishbone diagram is often used in business to determine the cause of some problem. The diagram illustrates the main causes and sub-causes leading to an event. The main goal of the Fishbone diagram is to illustrate in a graphical way the relationship between a given outcome and all the factors that influence this outcome. The complete diagram resembles a fish skeleton as its name implies. The ability to create a Fishbone Diagram is supported by the Fishbone Diagram solution. Use ConceptDraw MINDMAP for structuring data and then ConceptDraw PRO for generating a Fishbone Diagram from mind map structure.This cause and effect diagram sample was redesigned from the Wikimedia Commons file: Fishbone BadCoffeeExample.jpg. [commons.wikimedia.org/ wiki/ File:Fishbone_ BadCoffeeExample.jpg]
This file is licensed under the Creative Commons Attribution-Share Alike 3.0 Unported license. [creativecommons.org/ licenses/ by-sa/ 3.0/ deed.en]
The fishbone diagram example "Bad coffee" was created using the ConceptDraw PRO diagramming and vector drawing software extended with the Fishbone Diagrams solution from the Management area of ConceptDraw Solution Park.
HelpDesk
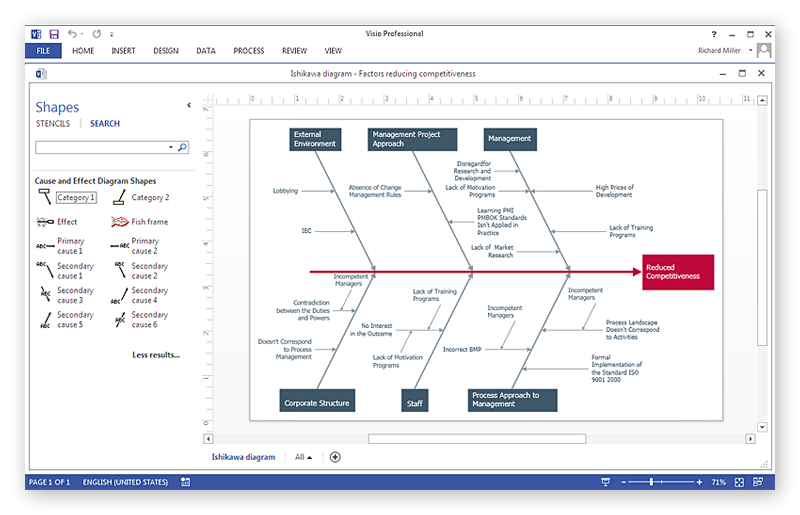
How To Create a MS Visio Cause and Effect Diagram Using ConceptDraw PRO
Cause-and-Effect Ishikawa Diagram is a graphical method of analysis and cause-effect relationships, a tool in the form of fish bone. It is used to systematically determine the cause of the problem and represent it graphically. The technique is primarily used in the framework of quality management for the analysis of quality problems and their causes. Nowadays, it has found worldwide distribution and is used in multiple problem areas. It is one of the tools of lean manufacturing, which is used in group work to find the problems and their causes. ConceptDraw PRO allows you to easily create Fishbone (Ishikawa) diagram and then make a MS Visio VSDX, or VSD files from your diagrams in a couple clicks, using the export capabilities of ConcewptDraw PRO.This example was created on the base of the figure from the website of the Iowa State University Center for Excellence in Learning and Teaching.
"Fishbone.
What: The fishbone technique uses a visual organizer to identify the possible causes of a problem.
Benefits: This technique discourages partial or premature solutions and demonstrates the relative importance of, and interactions between, different parts of a problem.
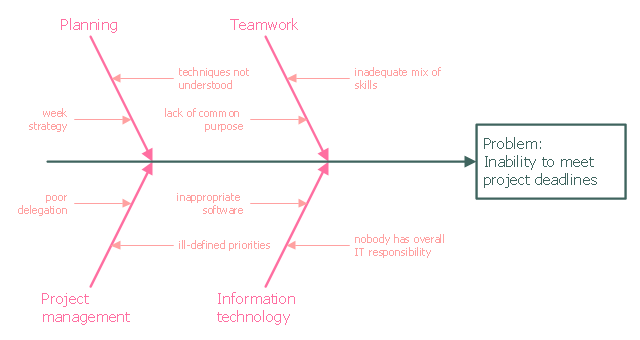
How: On a broad sheet of paper, draw a long arrow horizontally across the middle of the page pointing to the right. Label the arrowhead with the title of the issue to be explained. This is the "backbone" of the "fish." Draw "spurs" from this "backbone" at about 45 degrees, one for every likely cause of the problem that the group can think of; and label each. Sub-spurs can represent subsidiary causes. The group considers each spur/ sub-spur, taking the simplest first, partly for clarity but also because a simple explanation may make more complex ones unnecessary. Ideally, the fishbone is redrawn so that position along the backbone reflects the relative importance of the different parts of the problem, with the most important at the head." [celt.iastate.edu/ creativity/ techniques.html]
The fishbone diagram example "Inability to meet project deadlines" was created using the ConceptDraw PRO diagramming and vector drawing software extended with the Fishbone Diagrams solution from the Management area of ConceptDraw Solution Park.
- Using Fishbone Diagrams for Problem Solving | Cause and Effect ...
- Fish Bone Defect Product
- Fishbone Diagram | Management | Cisco Network Diagrams ...
- Fishbone Diagram | Business Productivity Diagramming | How to ...
- Fishbone Diagram | Management | PM Response | Maintenance ...
- Fault Tree Analysis Diagrams | Fishbone Diagram | Structured ...
- Fish Bone Analysis
- PROBLEM ANALYSIS . Root Cause Analysis Tree Diagram | How To ...
- Various Steps Of Problem Solving And Explain Fish Bone Analysis
- Cause and Effect Analysis | Fishbone Diagram | Cause and Effect ...
- Fish Bones Samples
- Quality Fish Bone
- Fish Bone Dfd Context Diagram
- What Is A Fish Bone Diagram In Computer Science
- Fish Bone Diagram
- Fishbone Diagrams | How to Create a Fishbone (Ishikawa) Diagram ...
- Fish Bone Mind Map
- Fishbone Diagrams | Fishbone Diagram | Engineering | Engineering ...
- Fishbone Diagram | Business Productivity Diagramming ...
- Fish Bone Diagram Related To Management


