 Fishbone Diagram
Fishbone Diagrams solution extends ConceptDraw PRO software with templates, samples and library of vector stencils for drawing the Ishikawa diagrams for cause and effect analysis.
 Fishbone Diagrams
The Fishbone Diagrams solution extends ConceptDraw PRO v10 software with the ability to easily draw the Fishbone Diagrams (Ishikawa Diagrams) to clearly see the cause and effect analysis and also problem solving. The vector graphic diagrams produced using this solution can be used in whitepapers, presentations, datasheets, posters, and published technical material.
 Meter Dashboard
Meter dashboard solution extends ConceptDraw PRO software with templates, samples and vector stencils library with meter indicators for drawing visual dashboards showing quantitative data.
HelpDesk
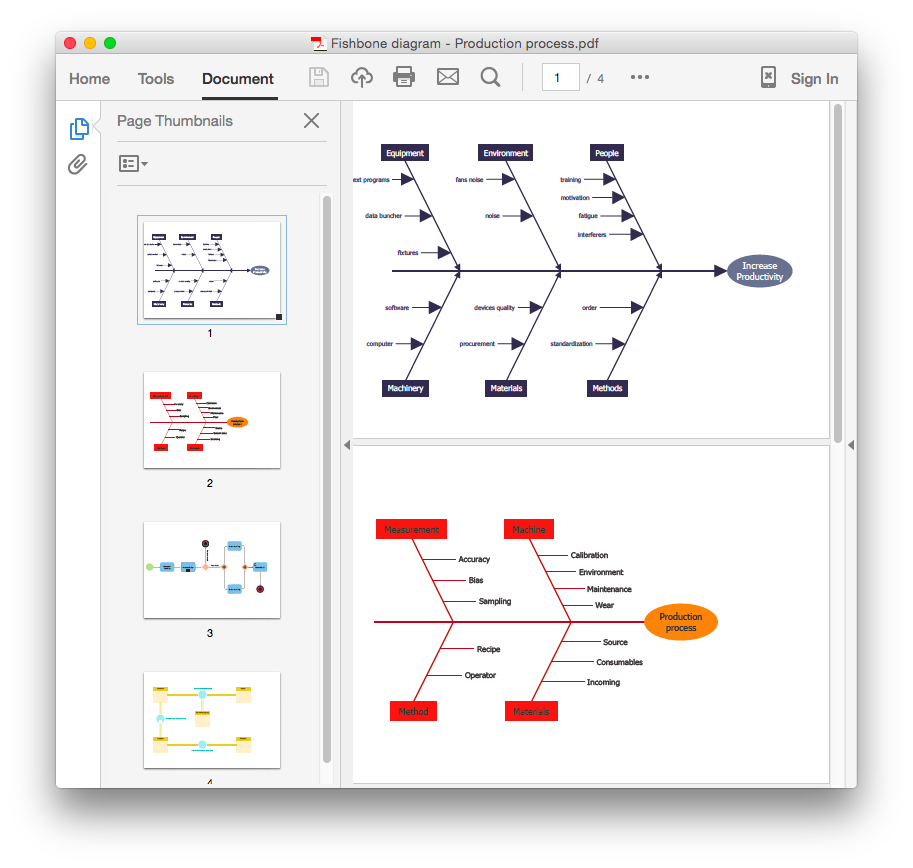
How To Convert a Fishbone Diagram to Adobe PDF Using ConceptDraw PRO
ConceptDraw PRO allows you to easy transmit visual documentation between different computers with different operating systems and applications using it's export capabilities.You can get clear business documentation pack in pdf format and easily communicate it with stakeholders.
 Sales Dashboard
Sales Dashboard solution extends ConceptDraw PRO software with templates, samples and library of vector stencils for drawing the visual dashboards of sale metrics and key performance indicators (KPI).
Sales KPI Dashboards
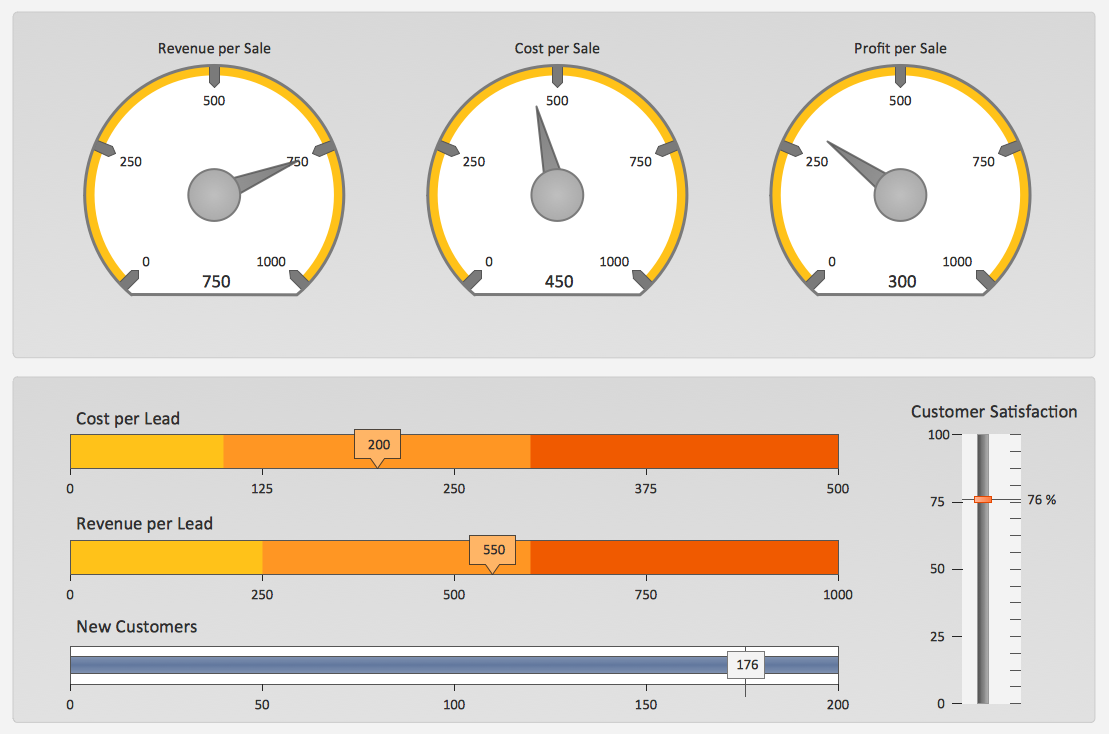
A combination of sales KPI on a one dashboard helps you track sales activities and results. Visualizing sales data using ConceptDraw PRO software extended with the Sales Dashboard solutiongives you flexibility in choosing and tuning KPIs.
 Spatial Dashboard
Spatial dashboard solution extends ConceptDraw PRO software with templates, samples and vector stencils libraries with thematic maps for drawing visual dashboards showing spatial data.
 Status Dashboard
Status dashboard solution extends ConceptDraw PRO software with templates, samples and vector stencils libraries with graphic indicators for drawing the visual dashboards showing status data.
 Frequency Distribution Dashboard
Frequency distribution dashboard solution extends ConceptDraw PRO software with samples, templates and vector stencils libraries with histograms and area charts for drawing the visual dashboards showing frequency distribution of data.
 ConceptDraw Solution Park
ConceptDraw Solution Park collects graphic extensions, examples and learning materials
 What is a Dashboard Area
Solutions from the area What is a Dashboard of ConceptDraw Solution Park collects templates, samples and vector stencils libraries with of data driven charts and indicators for drawing the basic types of Visual Dashboards.
 Time Series Dashboard
Time series dashboard solution extends ConceptDraw PRO software with templates, samples and vector stencils libraries with charts, graphs and plots for drawing the visual dashboards showing data time series.
 ConceptDraw Dashboard for Facebook
ConceptDraw Dashboard for Facebook solution extends ConceptDraw PRO software with a dynamically updated visual dashboard, which shows lifetime total likes, daily friends of fans, and daily page views, information you can receive from Facebook Insights.
Sales Dashboard - insight about potential opportunities and key sales operations
ConceptDraw Sales Dashboard gives you a clear insight about potential opportunities and key sales operations. Analysing sales KPI is a proven way to see how your business can improve.
 Comparison Dashboard
Comparison dashboard solution extends ConceptDraw PRO software with samples, templates and vector stencils library with charts and indicators for drawing the visual dashboard comparing data.
- Fishbone Diagram | Sales Dashboard | Fishbone Diagrams ...
- Fishbone Diagram For Sales Performance
- Fishbone Dashboard
- Fishbone Diagrams | Sales KPI Dashboards | Fishbone Diagram ...
- Sales Dashboard | MindWave for SAP Streamworks | Fishbone ...
- Health Food | Sales Dashboard | Fishbone Diagrams | Show The ...
- Fishbone Diagrams | Sales Dashboard | Pyramid Diagrams ...
- Fishbone Diagrams | Fishbone Diagram | ConceptDraw Solution ...
- Fishbone Diagram | HVAC Plans | Correlation Dashboard | Air ...
- Fishbone Diagram | HVAC Plans | Correlation Dashboard | Ckass ...
- Draw Fishbone Diagram on MAC Software | Circular Arrows ...
- Fishbone Diagram | Project Management Area | Business ...
- Fishbone Diagrams | Value stream with ConceptDraw PRO ...
- Cause and Effect Analysis - Fishbone Diagrams for Problem Solving ...
- PM Dashboards | How To Create Project Report | KPI Dashboard ...
- How to Create a CCTV Diagram in ConceptDraw PRO | Fishbone ...
- Fishbone Diagram Problem Solving | Using Fishbone Diagrams for ...
- Fishbone Diagrams | Process Flowchart | Fault Tree Analysis ...
- Note Exchange | Time Series Dashboard | Spatial Infographics ...
- How to Create a Sales Dashboard Using ConceptDraw PRO | What ...


