Venn Diagram Examples for Problem Solving. Environmental Social Science. Human Sustainability Confluence
The Venn diagram example below shows sustainable development at the confluence of three constituent parts. Create your Venn diagrams for problem solving in environmental social science using the ConceptDraw DIAGRAM diagramming and vector drawing software extended with the Venn Diagrams solution from the area "Diagrams" of ConceptDraw Solution Park.Workflow Diagram
Workflow diagram is a perfect tool to represent visually a repeatable pattern of organizational activity that is powered by resources and to describe in details the transferring of data, documents or tasks during a work process. It effectively explains and documents the process flow that exists and that requires the studying, analyzing and execution. Workflow diagrams help to represent the working processes in a simple visual manner, to follow easy the path of a task in a workflow, to identify the persons responsible for the execution of each stage, to show the accompanied documents and needed resources. All this helps to optimize the workflow and to discover its weak points. Workflow diagrams are mainly designed and used as a part of project documentation, certification process and company policies to comply the standards. To design professionally the Workflow diagrams, use the ConceptDraw DIAGRAM software. Enhanced with Workflow Diagrams solution from the Business Processes area, the ConceptDraw DIAGRAM it is a powerful workflow diagram maker.
 Audit Flowcharts
Audit flowcharts solution extends ConceptDraw DIAGRAM software with templates, samples and library of vector stencils for drawing the audit and fiscal flow charts.
PDPC
ConceptDraw DIAGRAM extended with Seven Management and Planning Tools Solution from the Management Area of ConceptDraw Solution Park is the best software for drawing all types of diagrams from the Seven Management and Planning Tools: Affinity Diagram, Relations Diagram, Prioritization Matrix, Root Cause Analysis Tree Diagram, Involvement Matrix, PERT Chart, and Risk Diagram (PDPC).
 Seven Management and Planning Tools
Seven Management and Planning Tools solution extends ConceptDraw DIAGRAM and ConceptDraw MINDMAP with features, templates, samples and libraries of vector stencils for drawing management mind maps and diagrams.
 SWOT and TOWS Matrix Diagrams
SWOT and TOWS Matrix Diagrams solution extends ConceptDraw DIAGRAM and ConceptDraw MINDMAP software with features, templates, samples and libraries of vector stencils for drawing SWOT and TOWS analysis matrices and mind maps.
 Management Area
The solutions from Management area of ConceptDraw Solution Park collect templates, samples and libraries of vector stencils for drawing the management diagrams and mind maps.
 ConceptDraw Solution Park
ConceptDraw Solution Park collects graphic extensions, examples and learning materials
 Stakeholder Onion Diagrams
The Stakeholder Onion Diagram is often used as a way to view the relationships of stakeholders to a project goal. A basic Onion Diagram contains a rich information. It shows significance of stakeholders that will have has influence to the success achieve
HelpDesk
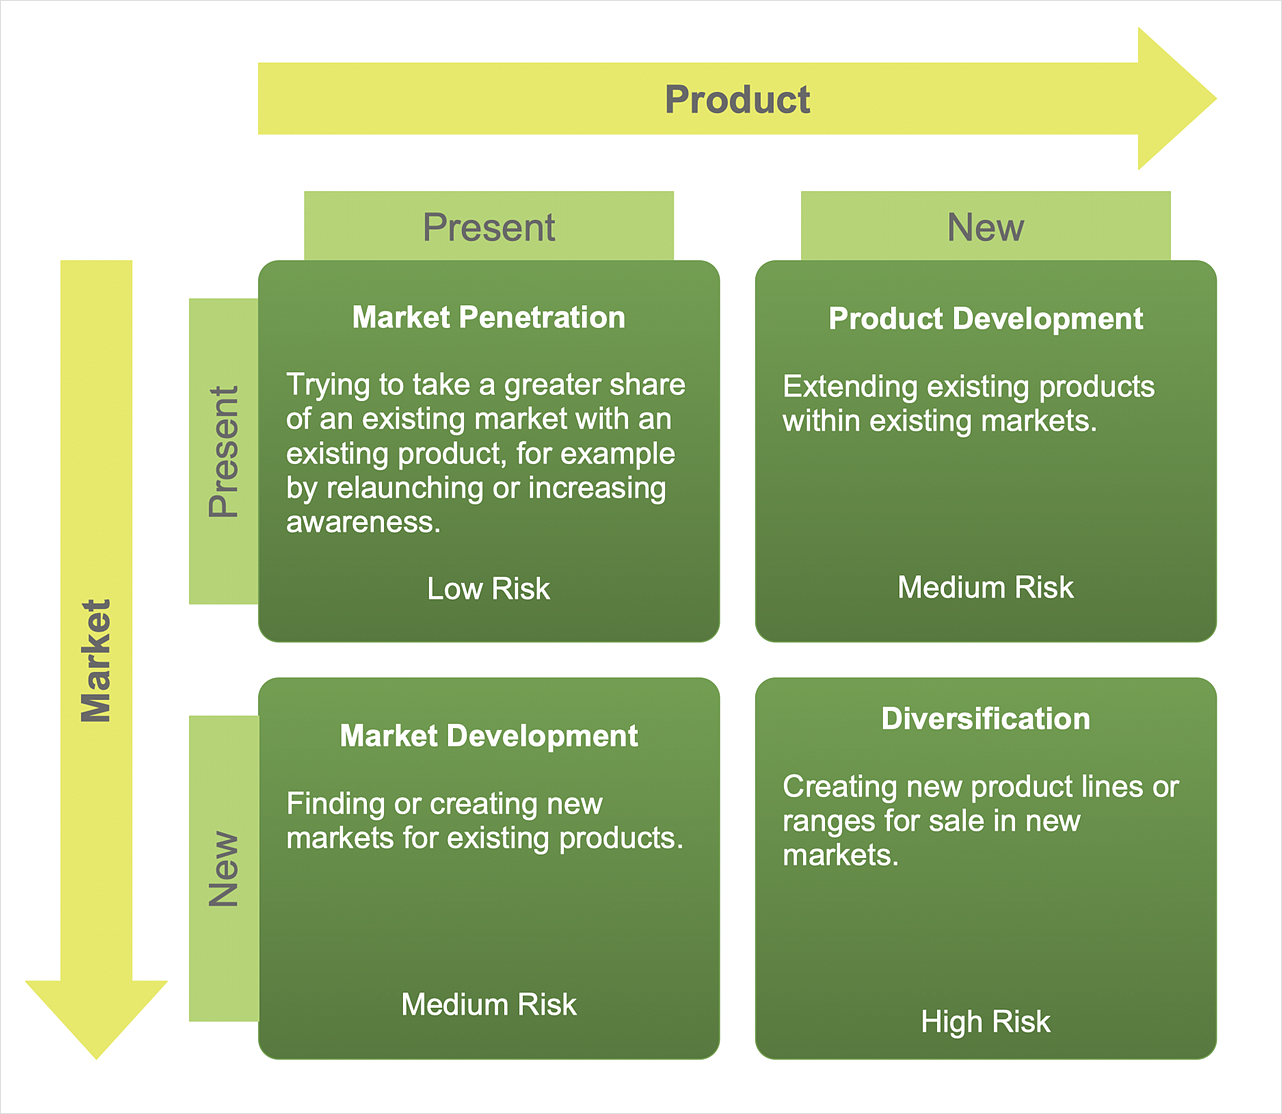
How to Make an Ansoff Matrix Template
Ansoff Matrix is a business strategic management tool that helps a business determine its product and market growth strategy. Ansoff matrix has four sections to show each impacting ways that businesses can grow. Using Ansoff Matrix enables determining the current position of any business in the industry and choose the direction of its growth, which would provide the most competitive position. While Ansoff Matrix is most commonly used as a business planning tool it can be used also for personal development. You can make Ansoff Matrix template for your organization using ConceptDraw DIAGRAM Matrices solution.
 Circle-Spoke Diagrams
Examples of subject areas that are well suited to this approach are marketing, business, products promotion, process modeling, market, resource, time, and cost analysis. Circle-Spoke Diagrams are successfully used in presentations, conferences, management documents, magazines, reportages, reviews, reports, TV, and social media.
 Basic Circle-Spoke Diagrams
Basic circle-spoke diagrams are well suited for marketing, management documents, and presentations.
 GHS Hazard Pictograms
GHS Hazard Pictograms solution contains the set of predesigned standard GHS pictograms, Hazardous symbols, and Hazard communication pictograms, approved and agreed by UN in Globally Harmonized System of Classification and Labelling of Chemicals (GHS). They can be used for quick and simple designing accurate and professional-looking infographics, diagrams, warning announcements, signboards, posters, precautionary declarations, regulatory documents, and for representing the main items of OSHA HAZCOM Standard.
 Sales Flowcharts
The Sales Flowcharts solution lets you create and display sales process maps, sales process workflows, sales steps, the sales process, and anything else involving sales process management.
 Mind Map Exchange
This solution extends ConceptDraw MINDMAP software with the ability to easily exchange mind maps with a large variety of other mind mapping applications.
- Fishbone Theory In Financial Risk Management
- Fishbone Diagram Risk Management
- Fishbone diagram - Bad coffee | Fishbone Diagrams | Fishbone ...
- Fishbone diagram - HAN project | CORRECTIVE ACTIONS ...
- Using Fishbone Diagrams for Problem Solving | Venn Diagram ...
- Cause and Effect Analysis | Process Flowchart | Draw Fishbone ...
- Competitor Analysis | Process Flowchart | Fishbone Diagrams ...
- Bar Diagrams for Problem Solving. Create economics and financial
- Health Diagrams
- Fishbone Diagram Problem Solving | Using Fishbone Diagrams for ...
- Financial Management Process Diagram
- Pyramid Diagram | Block diagram - Document management system ...
- Bar Diagrams for Problem Solving. Create economics and financial ...
- Flow Chart Cause And Solution
- It Security Risks
- PROBLEM ANALYSIS. Root Cause Analysis Tree Diagram ...
- Team psychological characteristics - Concept map | Safety and ...
- Fishbone Diagram Problem Solving | Cause and Effect Analysis ...
- Fault Tree Diagram Software
- Top iPad Business Process Diagrams Apps | PROBLEM ANALYSIS ...


