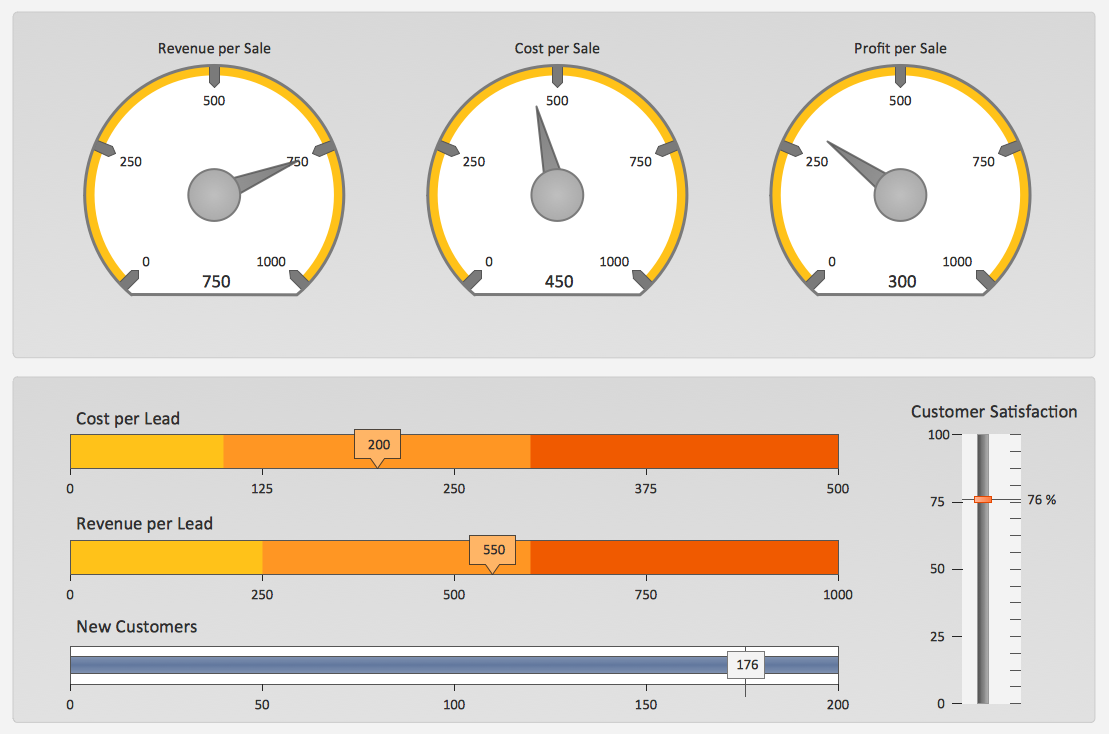
Sales KPI Dashboards
A combination of sales KPI on a one dashboard helps you track sales activities and results. Visualizing sales data using ConceptDraw PRO software extended with the Sales Dashboard solutiongives you flexibility in choosing and tuning KPIs.
 Sales Dashboard
Sales Dashboard solution extends ConceptDraw PRO software with templates, samples and library of vector stencils for drawing the visual dashboards of sale metrics and key performance indicators (KPI).
 Sales Dashboard
Sales Dashboard solution extends ConceptDraw PRO software with templates, samples and library of vector stencils for drawing the visual dashboards of sale metrics and key performance indicators (KPI).
 Meter Dashboard
Meter dashboard solution extends ConceptDraw PRO software with templates, samples and vector stencils library with meter indicators for drawing visual dashboards showing quantitative data.
 Marketing Area
The solutions from Marketing area of ConceptDraw Solution Park collect templates, samples and libraries of vector stencils for drawing the marketing diagrams and mind maps.
 Composition Dashboard
Composition dashboard solution extends ConceptDraw PRO software with templates, samples and vector stencils library with charts and indicators for drawing visual dashboards showing data composition.
 PM Dashboards
This solution extends ConceptDraw PRO and ConceptDraw PROJECT software with the ability to clearly display the identified key performance indicators for any project.
 Comparison Dashboard
Comparison dashboard solution extends ConceptDraw PRO software with samples, templates and vector stencils library with charts and indicators for drawing the visual dashboard comparing data.
 Workflow Diagrams
Workflow Diagrams solution extends ConceptDraw PRO software with samples, templates and vector stencils library for drawing the work process flowcharts.
 Wireless Networks
Wireless Networks solution extends ConceptDraw PRO software with templates, samples and vector stencils library for drawing the wireless computer communication network diagrams.
 Correlation Dashboard
Correlation dashboard solution extends ConceptDraw PRO software with samples, templates and vector stencils library with Scatter Plot Charts for drawing the visual dashboard visualizing data correlation.
 What is a Dashboard Area
Solutions from the area What is a Dashboard of ConceptDraw Solution Park collects templates, samples and vector stencils libraries with of data driven charts and indicators for drawing the basic types of Visual Dashboards.
- Sales Process Flowchart. Flowchart Examples | Fishbone Diagram ...
- Fishbone Diagram | Marketing | Sales KPI Dashboards | Ishikawa ...
- Entity-Relationship Diagram (ERD) | Marketing | Fishbone Diagram ...
- Sales Dashboard | Sales Process Flowchart. Flowchart Examples ...
- Business Process Diagram | Fishbone Diagram | Marketing and ...
- Sales KPI Dashboards
- Fishbone Diagram | Sales KPI Dashboards | Management ...
- Marketing | How to Deliver Presentations using Mind Maps | Sales ...
- Entity-Relationship Diagram (ERD) | Sales Dashboard | Martin ERD ...
- Sales Dashboard | Online Collaboration via Skype | Seven ...
- Sales Performance | PM Dashboards | Sales Dashboard Solutions ...
- A KPI Dashboard | Constant improvement of key performance ...
- Sales KPI Dashboards
- A KPI Dashboard | Sales KPI Dashboards | Sales Dashboard
- Seven Management and Planning Tools | Entity-Relationship ...
- A KPI Dashboard | Sales KPI Dashboards | A KPI Dashboard ...
- Constant improvement of key performance indicators | TQM Diagram ...
- A KPI Dashboard Provides the Answers Your Sales Team
- Sales Dashboard | PM Dashboards | A KPI Dashboard | Key ...
- Sales Dashboard | How to Create a Sales Dashboard ...
