 Fishbone Diagram
Fishbone Diagrams solution extends ConceptDraw PRO software with templates, samples and library of vector stencils for drawing the Ishikawa diagrams for cause and effect analysis.
HelpDesk
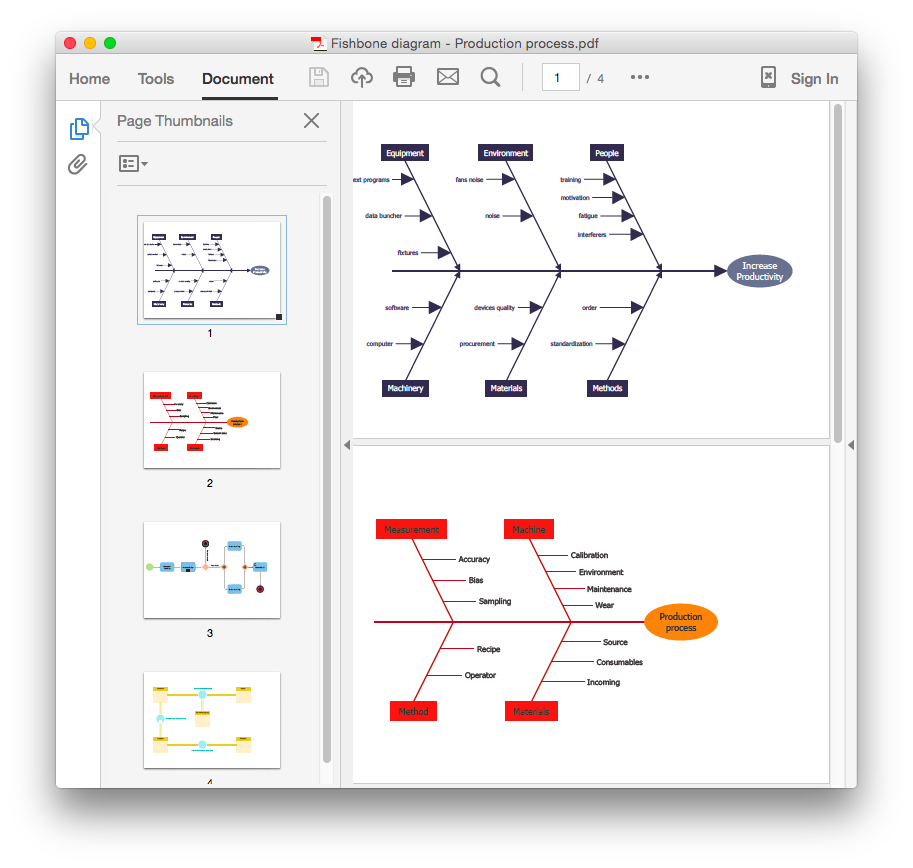
How To Convert a Fishbone Diagram to Adobe PDF
ConceptDraw PRO allows you to easy transmit visual documentation between different computers with different operating systems and applications using it's export capabilities.You can get clear business documentation pack in pdf format and easily communicate it with stakeholders.Total Quality Management Value
The Total quality management (TQM) is an enterprise-wide method of continuous quality improvement of all organizational processes, including the enhancement of ability to deliver high-quality products and services to the customers. The TQM includes eight main elements, which have great value: customer-focused, process-centered, total employee involvement, integrated system, continual improvement, strategic and systematic approach, fact-based decision making, communications. ConceptDraw PRO diagramming and vector drawing software offers the Total Quality Management Diagram solution with effective drawing tools, predesigned vector elements, samples and templates that help easy design the Total Quality Management diagrams, TQM flowcharts and Mind Maps widely used in quality management projects to visualize the business processes and industrial processes for your organization, to demonstrate the quality control step-by-step in a visual manner, to compare visually the ideal and real stages of processes.HelpDesk
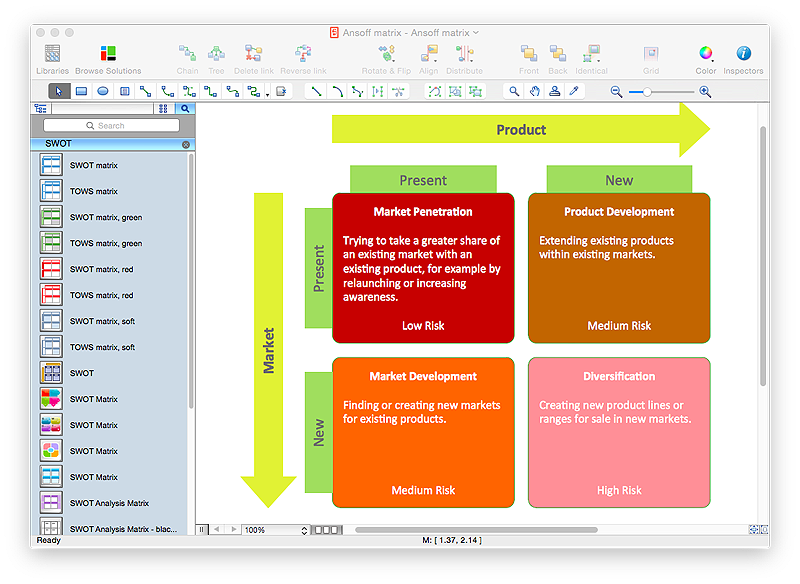
How to Make an Ansoff Matrix Template in ConceptDraw PRO
Ansoff Matrix is a business strategic management tool that helps a business determine its product and market growth strategy. Ansoff matrix has four sections to show each impacting ways that businesses can grow. Using Ansoff Matrix enables determining the current position of any business in the industry and choose the direction of its growth, which would provide the most competitive position. While Ansoff Matrix is most commonly used as a business planning tool it can be used also for personal development. You can make Ansoff Matrix template for your organization using ConceptDraw PRO Matrices solution.
 Entity-Relationship Diagram (ERD)
Entity-Relationship Diagram (ERD) solution extends ConceptDraw PRO software with templates, samples and libraries of vector stencils from drawing the ER-diagrams by Chen's and crow’s foot notations.
HelpDesk
How to Create SWOT Analysis Template Using ConceptDraw PRO
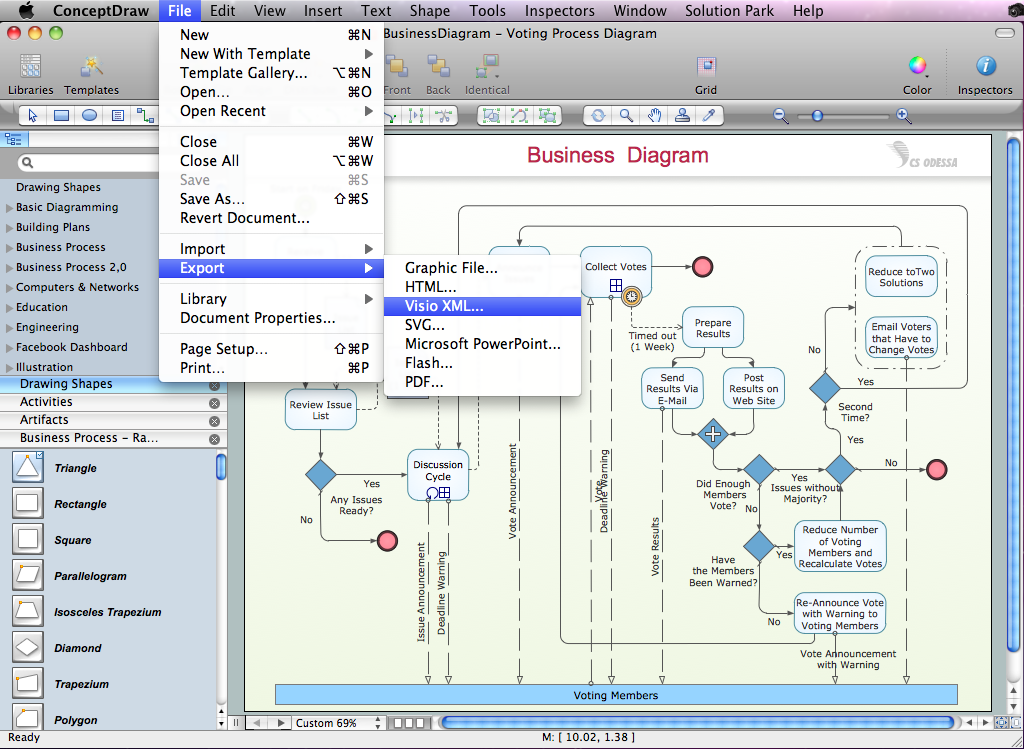
SWOT-analysis is used to develop a marketing strategy. SWOT-analysis includes determining the strengths and weaknesses in the company's activity, potential external threats and opportunities and assesses their relative strategic competitors. ConceptDraw SWOT and TOWS Matrix Diagrams solution provide a set of SWOT matrix in which should be recorded and then compared the strengths and weaknesses of the enterprise and the market opportunities and threats. This comparison allows you to determine what steps can be taken for the development of your company and what problems need to be addressed urgently.Export from ConceptDraw PRO Document to MS Visio® XML
Once you have created your document in ConceptDraw PRO and you want to share it with your colleagues and friends, who uses MS Visio on their computers, you can easily export your document using ConceptDraw PRO export to Visio XML files (VDX) feature. Now you can share your ConceptDraw documents with MS Visio users.
HelpDesk
How to Create a Stakeholder Onion Diagram
The Stakeholder Onion Diagram is stakeholder analysis tool from the arsenal of project management. It is used to display the relationships of stakeholders to a project goal. An Onion Diagram shows how the stakeholder activities affect the project results. The ConceptDraw Stakeholder Onion Diagram solution is intended to depict how the relationships that subsists in a project environment can influence on a project. A set of libraries and objects provided by this solution make ashort work of visualizing the stakeholder analysis of a project.
 Visio Exchange
Our Visio Exchange tool allows you to Import and export native MS Visio 2013 files that are in the new MS Visio drawing (VSDX) format introduced in the most recent Visio iteration. In addition, ConceptDraw PRO v10 supports the import and export of MS Visio 2007-2010 XML. (VDX) files more accurately then previous versions of ConceptDraw PRO. If you have the older MS Visio 2007-2010.
HelpDesk
How to Draw a Pyramid Diagram in ConceptDraw PRO
Pyramid diagram (triangle diagram) is used to represent data, which have hierarchy and basics. Due to the triangular form of diagram, each pyramid section has a different width. The width of the segment shows the level of its hierarchy. Typically, the top of the pyramid is the data that are more important than the base data. Pyramid scheme can be used to show proportional and hierarchical relationships between some logically related items, such as departments within an organization, or successive elements of any process. This type of diagram is often used in marketing to display hierarchical related data, but it can be used in a variety of situations. ConceptDraw PRO allows you to make a pyramid diagram, quickly and easily using special libraries.Export from ConceptDraw PRO Document to a Graphic File
Now it’s easy to share your visual documents with other people in a form most convenient for them. ConceptDraw PRO can save your drawings and diagrams in a number of highly useful formats, including graphic files. You can save your drawing as a .PNG, .JPG, or other graphic format file.
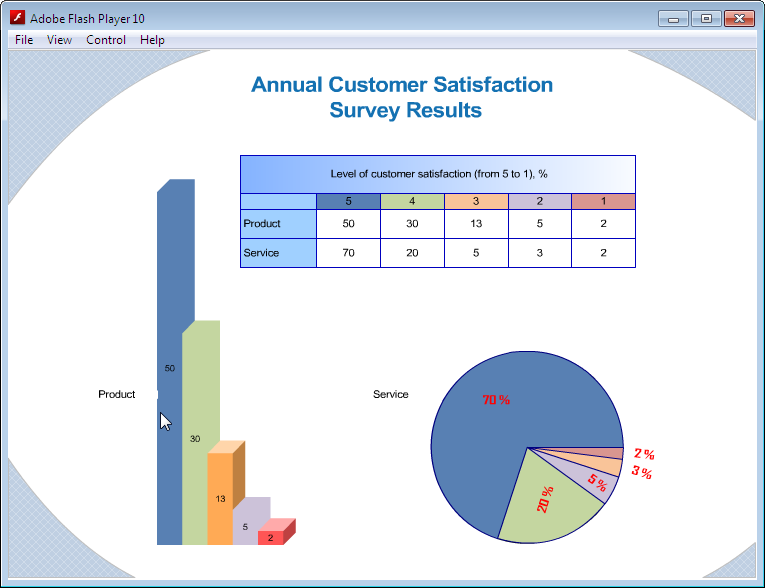
Export from ConceptDraw PRO Document to SWF (Adobe® Flash®) File
ConceptDraw PRO’s has extensive export capabilities which allow you to export your drawing as MS PowerPoint® and Adobe PDF files. You can also embed a drawing into an HTML page after saving it in SWF or SVG formats.
Export from ConceptDraw PRO Document to PPT or PPTX (MS PowerPoint®) File
ConceptDraw PRO has extensive export capabilities which allow you to export your drawing to
 PM Response
This solution extends all ConceptDraw Office 2.0 products by helping to improve the response time to project changes. PM Response also helps with iteration planning, discussing project layout approaches, and solving project challenges.
 PM Easy
This solution extends ConceptDraw PROJECT software with the ability to quickly start a project; it lists task relationships and dependencies to make iterative planning easy.
- Service 8 Ps fishbone diagram - Template | Fishbone Diagram ...
- Fishbone Diagram | Business Productivity Diagramming | Business ...
- Manufacturing 8 Ms fishbone diagram - Template | Data Flow ...
- Cause and Effect Analysis | Fishbone Diagram | Cause and Effect ...
- Fishbone Diagram | Cross-Functional Flowcharts | Fish Diagram ...
- Business Productivity Diagramming | Fishbone Diagram | Office ...
- Cause and Effect Analysis ( Fishbone Diagrams ) | Business ...
- Fishbone Diagram | Business Productivity Diagramming | How to ...
- Fishbone Diagram | Wireless Networks | Project Exchange | How To ...
- PROBLEM ANALYSIS. Root Cause Analysis Tree Diagram | Cause ...
- Cause and Effect Analysis ( Fishbone Diagrams ) | Business ...
- SWOT Analysis | How to Create Multipage Diagram | Fishbone ...
- Fishbone Diagram | Business Productivity Diagramming | Business ...
- Fishbone Diagram | How to Draw a Computer Network Diagrams ...
- Images Of Fishbone Diagram
- How to Create a Fishbone ( Ishikawa ) Diagram Quickly | How To ...
- Business Productivity Diagramming | Fishbone Diagram | How to ...
- Fishbone Diagram | Business Productivity Diagramming | Use a ...
- UML Diagrams with ConceptDraw PRO | Basic Diagramming ...
- Fishbone Diagram | Entity-Relationship Diagram (ERD) | Entity ...
