This site uses cookies. By continuing to browse the ConceptDraw site you are agreeing to our Use of Site Cookies.
HelpDesk

How To Create Cause and Effect (Fishbone) Diagram in MS Visio

Cause-and-Effect Ishikawa Diagram is a graphical method of analysis and cause-effect relationships, a tool in the form of fish bone. It is used to systematically determine the cause of the problem and represent it graphically. The technique is primarily used in the framework of quality management for the analysis of quality problems and their causes. Nowadays, it has found worldwide distribution and is used in multiple problem areas. It is one of the tools of lean manufacturing, which is used in group work to find the problems and their causes. ConceptDraw DIAGRAM allows you to easily create Fishbone (Ishikawa) diagram and then make an MS Visio VSDX, or VSD files from your diagrams in a couple clicks, using the export capabilities of ConceptDraw DIAGRAM.

When To Use a Fishbone Diagram

Fishbone diagrams work for most entrepreneurs and almost any industry or person having a problem. Professional diagramming software may help you create Fishbone (Cause and Effect or Ishikawa) diagrams. When people are unclear about what is causing an issue, ConceptDraw DIAGRAM will be your lifesaver.
When to use a Fishbone diagram? Originally developed as a quality control tool, you may find a Fishbone diagram helpful when used in many cases, such as to analyze a complex problem when there are many causes, for identifying all possible root causes for an effect or a problem, when you need different point of view to look on a problem, to uncover bottlenecks and identify where and why a process doesn't work, for acceleration a process when traditional ways of problem solving consume many time.

Fishbone Diagram Template

A causal model is an abstract concept, that describes the causal mechanisms of a system, by noting certain variables and their influence on each other, in an effort to discover the cause of a certain problem or flaw. This model is presented in diagram form by using a fishbone diagram.
ConceptDraw DIAGRAM diagramming and vector drawing software enhanced with Fishbone Diagrams solution helps you create business productivity diagrams from Fishbone diagram templates and examples, that provide to start using of the graphic method for the analysis of problem causes. Each predesigned Fishbone Diagram template is ready to use and useful for instantly drawing your own Fishbone Diagram.

ConceptDraw DIAGRAM Compatibility with MS Visio

For those who are migrating from MS Visio to ConceptDraw DIAGRAM, or for those who have colleagues and clients who use Visio, ConceptDraw DIAGRAM is compatible with MS Visio.VSDX formatted files.VSDX is Visio’s open XML file format, and it can be easily imported and exported by ConceptDraw DIAGRAM.

Draw Fishbone Diagram on MAC Software

There are many tools to facilitate the problem solving process. Cause and Effect diagram, or Fishbone diagram is one of them. Fishbone diagram can be constructed following 5 simple steps.
Professional diagramming ConceptDraw DIAGRAM MAC OSX software with Fishbone Diagrams solution helps you make cause and effect analysis, identify the possible causes for an effect for problem solving, draw Fishbone diagram on Mac software aka Ishikawa diagram from brainstorm, templates and examples.

Flowchart Software

Flowchart is widely used in business, education and economic presentations to help the audience visualize the content better, or to find flaws in a process flow diagrams. Flowcharts are particularly useful for displaying how a process currently flow or could ideally function. Flowcharts can help you see whether the steps of a process are logical, uncover problems or miscommunications, define the boundaries of a process, and develop a common base of knowledge about a process.

ConceptDraw DIAGRAM flowchart software will help to quickly create new flowcharts, workflow, NS Diagram, BPMN Diagram, Cross-functional flowcharts, data flow diagrams and highlight flowcharts.

Feature-rich flowchart maker, free thousand flowchart examples and templates and colored symbols that will allow you to create professional looking flowcharts simply.

ConceptDraw DIAGRAM supports macOS and Windows.
How to Build a Flowchart

Cause and Effect Diagrams

Cause and Effect Diagrams are designed to identify the potential factors that cause an overall effect. The causes are grouped into the categories, each cause is a source of variation.
ConceptDraw DIAGRAM powerful diagramming and vector drawing software provides the Fishbone Diagrams solution from the Management area of ConceptDraw Solution Park that allows to design the Cause and Effect Diagrams quick, easy and effective.

Fishbone Diagram Example
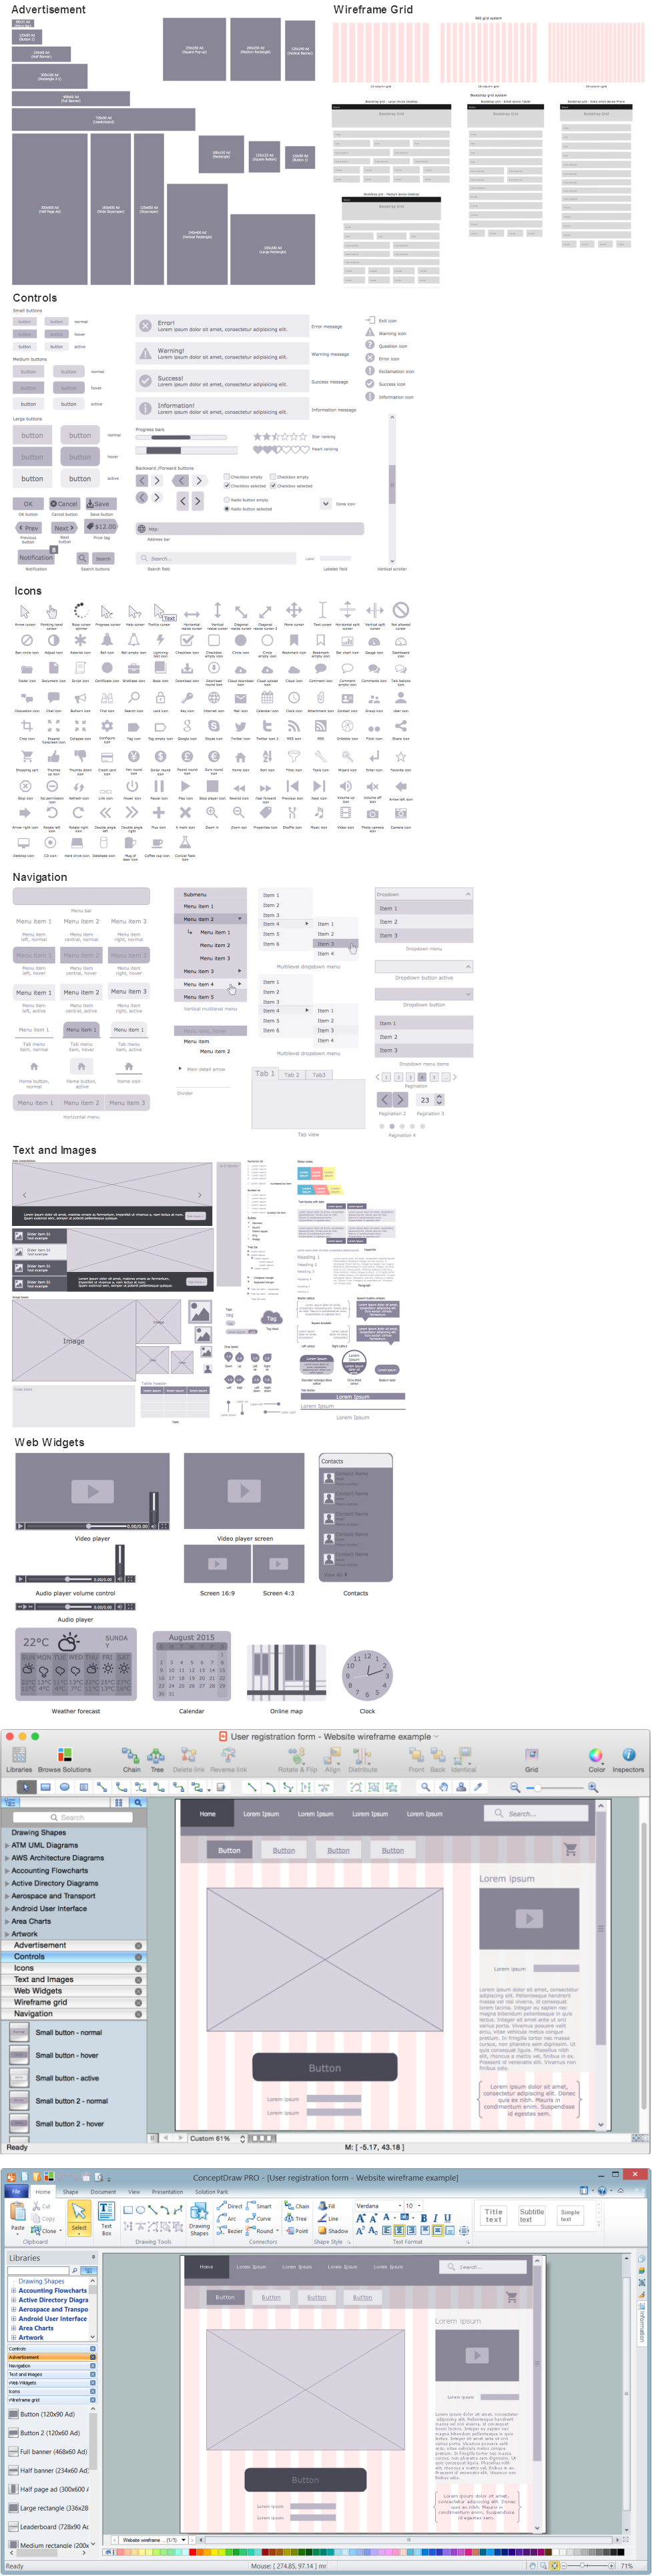
Fishbone Diagram, also referred as Cause and Effect diagram or Ishikawa diagram, is a fault finding and problem solving tool. Construction of Ishikawa diagrams is quite complicated process and has a number of features.
Fishbone Diagrams solution included to ConceptDraw Solution Park contains powerful drawing tools and a lot of examples, samples and templates. Each Fishbone diagram example is carefully thought-out by experts and is perfect source of inspiration for you.

Wireframing

Website wireframe is a detailed view of design or its skeleton. It shows all the important elements of the final website, the main groups of contents, information structure, describes the user's interaction with interface and its estimated visualisation.
ConceptDraw DIAGRAM extended with Website Wireframe solution from the Software Development area is the best wireframing software. Using the wireframe tools, libraries of vector objects, template and examples which offers a Website Wireframe solution, you will easily design the websites wireframes of any complexity.

Fishbone Diagram Procedure

ConceptDraw DIAGRAM diagramming and vector drawing software enhanced with Fishbone Diagrams solution from the Management area of ConceptDraw Solution Park gives the ability to draw Fishbone diagram, which identifies many possible causes for an effect for problem solving. Fishbone Diagram procedure of creation includes the set of steps easy for execution in ConceptDraw DIAGRAM.