 Fishbone Diagrams
The Fishbone Diagrams solution extends ConceptDraw PRO v10 software with the ability to easily draw the Fishbone Diagrams (Ishikawa Diagrams) to clearly see the cause and effect analysis and also problem solving. The vector graphic diagrams produced using this solution can be used in whitepapers, presentations, datasheets, posters, and published technical material.
 Fishbone Diagram
Fishbone Diagrams solution extends ConceptDraw PRO software with templates, samples and library of vector stencils for drawing the Ishikawa diagrams for cause and effect analysis.
"Causes in the diagram are often categorized, such as to ...
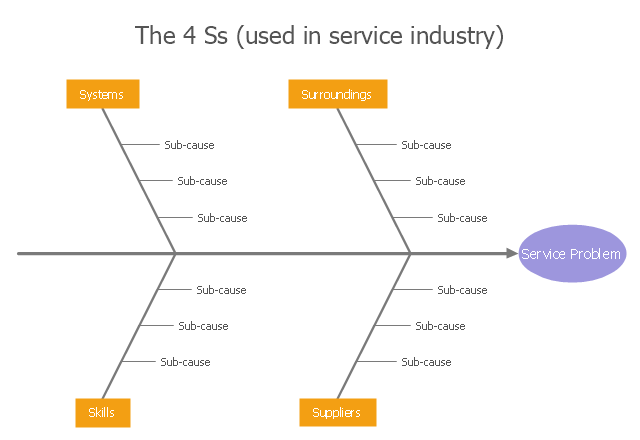
The 5 Ss (used in service industry):
(1) Samples;
(2) Scheme;
(3) Synchronous;
(4) Skin;
(5) Search." [Ishikawa diagram. Wikipedia]
This service 4 Ss Ishikawa diagram (cause and effect diagram) template is included in the Fishbone Diagram solution from the Management area of ConceptDraw Solution Park.
"Causes in the diagram are often categorized, such as to ...
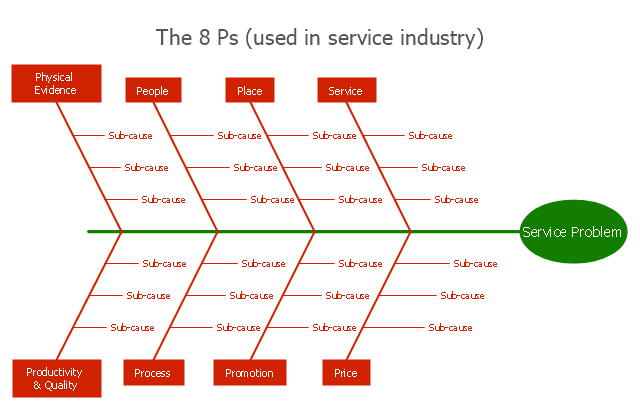
The 7 Ps (used in marketing industry):
(1) Product/ Service;
(2) Price;
(3) Place;
(4) Promotion;
(5) People/ personnel;
(6) Positioning;
(7) Packaging. " [Ishikawa diagram. Wikipedia]
This 8 Ps Ishikawa diagram (service cause and effect diagram) template is included in the Fishbone Diagram solution from the Management area of ConceptDraw Solution Park.
- Fishbone Diagram Example For Service Industry
- Fishbone Diagram Service Industry Example
- Fishbone Model For Service Industry
- Service 8 Ps fishbone diagram - Template | Fishbone Diagram ...
- Service Industry Fishbone Diagram
- Fishbone Diagram For Customer Service
- Result Analysis Diagram Service Industry
- Fishbone Diagrams | Fishbone Diagram | Service 4 Ss fishbone ...
- Block diagram - Gap model of service quality | Process Flowchart ...
- Service Industry Example For Fish Born Diagram
- Fishbone Service Industry
- Fishbone Diagram In Industry
- Diagram Of Service Industries
- Service 8 Ps fishbone diagram - Template | Fishbone Diagrams ...
- Flowchart Marketing Process. Flowchart Examples | Fishbone ...
- Fish Bone Diagram Construction Industry
- Fishbone Diagram Example For Manufacturing
- The Fish Bone Diagram In Service Marketing
- Service 4 Ss fishbone diagram - Template | Fishbone Diagram ...
- Fishbone Example In Telecom Industry

