Social Media Response
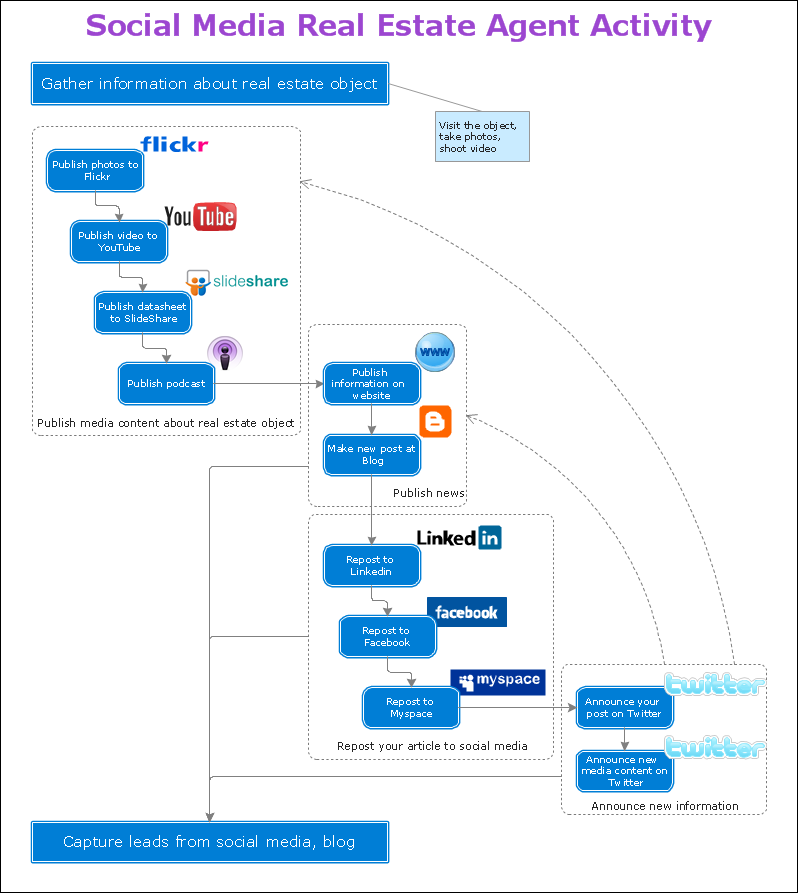
This solution extends ConceptDraw DIAGRAM and ConceptDraw MINDMAP with the ability to draw interactive flow charts with action mind map templates, to help create an effective response to applicable social media mentions.
Fishbone Diagram
Fishbone Diagrams solution extends ConceptDraw DIAGRAM software with templates, samples and library of vector stencils for drawing the Ishikawa diagrams for cause and effect analysis.
Fishbone Diagrams
The Fishbone Diagrams solution extends ConceptDraw DIAGRAM software with the ability to easily draw the Fishbone Diagrams (Ishikawa Diagrams) to clearly see the cause and effect analysis and also problem solving. The vector graphic diagrams produced using this solution can be used in whitepapers, presentations, datasheets, posters, and published technical material.
Fishbone Diagram
Identify the root causes of quality issues with Fishbone diagram. Because Fishbone diagram is hierarchical it is well-suited for capturing in a mind map for reviewing process towards proving which branch is the real root cause of an issue.ConceptDraw Arrows10 Technology
How should diagramming software work? The answer is - Fast and easy. "Tree"- mode drawing works like that. Just select objects in your drawing and press Tree or Chain button to connect all of them just in one click. Your diagram looks professional and it took only a moment to draw.Using Fishbone Diagrams for Problem Solving
Problems are obstacles and challenges that one should overcome to reach the goal. They are an inseparable part of any business, and the success of an enterprise often depends on ability to solve all problems effectively. The process of problem solving often uses rational approach, helping to find a suitable solution.Using Fishbone Diagrams for Problem Solving is a productive and illustrative tool to identify the most important factors causing the trouble. ConceptDraw DIAGRAM extended with Fishbone Diagrams solution from the Management area of ConceptDraw Solution Park is a powerful tool for problem solving with Fishbone Ishikawa diagram graphic method.
Organizing and Selecting Social Media Response Action
Interactive tool helps you find the appropriate response to social media mentions quickly.8 Step Problem Solving
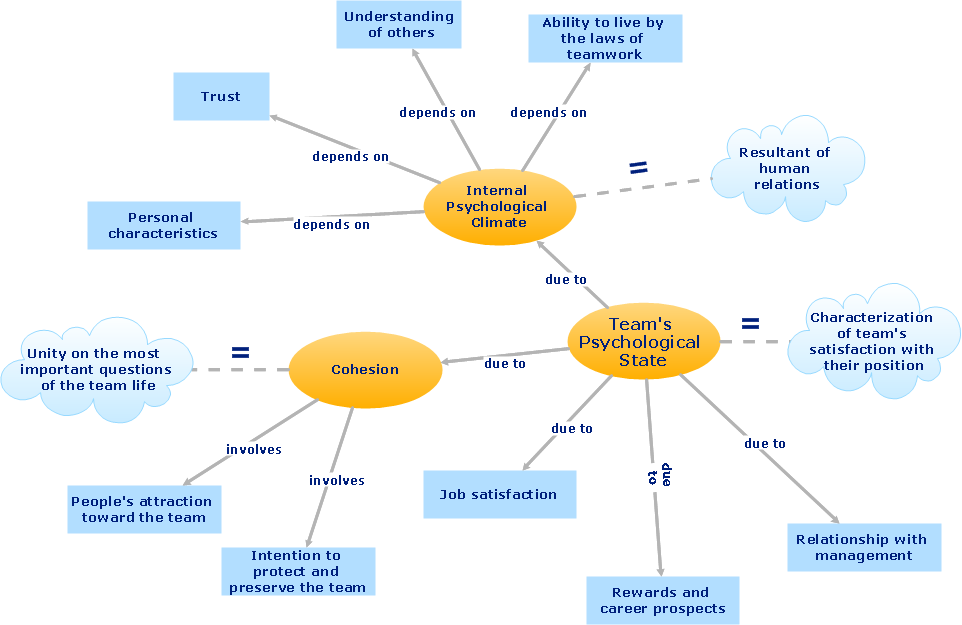
This mind map shows 8 steps approach to solving any kind of product or service problems.Relations Diagram
Identify how factors influence each other. Factors mostly influencing called “Drivers” Primarily affected factors called “Indicators”. Problem solving further focuses on changing driver factors by corrective actions. Indicator factors help establish KPI (Key Performance Indicators) to monitor changes and the effectiveness of corrective actions in resolving a problem.Business Productivity - Management
To support you in your tasks you can use the power of ConceptDraw DIAGRAM providingintelligent vector graphics that are useful for management diagramming and
ConceptDraw MINDMAP for key management mind maps.
Business Diagram Software
ConceptDraw business diagram Software is the most powerful business and relational charting software. Create advanced, completely customizable flow charts, organizational charts, business process diagrams, work flow diagrams, audit diagram, value stream maps, TQM diagrams, ERD diagrams, EPC diagrams, marketing diagrams, cause and effect diagrams, dashboards, infographics and other relational business diagrams from your data.Affinity Diagram
The Affinity Diagram shows the structure of large, complex factors that have an influence on a problem, and then divides them up into a smaller and simpler structure. The Affinity Diagram does not show a causal relationship between the factors. This diagram is designed to prepare the data for further analysis of the cause-effect relationships.Good Flow Chart app for Mac
The ConceptDraw DIAGRAM is a good flow chart app for Mac. Numerous vector stencils, samples and templates created by designers allows you to draw any type of flowchart.Onion Diagram Process Design
Onion diagram is a type of circular diagram that consists of the core circle representing the product/solution and concentric circles around it, which dependent on the core and look like the cross sections of onion.ConceptDraw DIAGRAM diagramming and vector drawing software supplied with Stakeholder Onion Diagrams Solution from the Management Area of ConceptDraw Solution Park is an ideal software for effective Onion diagram process design.
Australia Map
For graphic artists creating accurate maps of Australia. The Australia Map solution - allows designers to map Australia for their needs, offers a collection of scalable graphics representing the political geography of Australia, split into distinct state
- Social Media Er Diagram Example
- Example Of Fishbone Map That Have Answer
- Basic Flowchart Symbols and Meaning | Fishbone Diagrams | Social ...
- Social Media Flowchart Symbols | Rapid UML | Fishbone Diagrams ...
- Venn Diagram Examples for Problem Solving. Environmental Social ...
- Fish Bone Analysis For Customer Complaints
- Fishbone Diagram | Fishbone Diagram Template | Fishbone ...
- SWOT Analysis | Language Learning | Social Media Response ...
- How to Present a Social Media Response Plan DFD to Your Team ...
- Fish Bone Diagram About Social Service
- Using Fishbone Diagrams for Problem Solving | Diagrama de ...
- Interactive Voice Response Diagrams | Fishbone Diagrams | Social ...
- Marketing mix - Wheel diagram | Target market | Use of social media ...
- How to Create a Social Media DFD Flowchart | Presentation Clipart ...
- Cross-Functional Flowcharts | Total Quality Management with ...
- Leadership Training Influence | How to Create a Social Media DFD ...
- Process Flowchart | How to Connect Social Media DFD Flowchart ...
- Fishbone Diagram | PM Easy | Business Process Diagrams ...
- Fishbone Diagram | Process Flowchart | Example of DFD for Online ...
- How to Create a Social Media DFD Flowchart | How to Use the ...
- ERD | Entity Relationship Diagrams, ERD Software for Mac and Win
- Flowchart | Basic Flowchart Symbols and Meaning
- Flowchart | Flowchart Design - Symbols, Shapes, Stencils and Icons
- Flowchart | Flow Chart Symbols
- Electrical | Electrical Drawing - Wiring and Circuits Schematics
- Flowchart | Common Flowchart Symbols