Using Fishbone Diagrams for Problem Solving
Problems are obstacles and challenges that one should overcome to reach the goal. They are an inseparable part of any business, and the success of an enterprise often depends on ability to solve all problems effectively. The process of problem solving often uses rational approach, helping to find a suitable solution. Using Fishbone Diagrams for Problem Solving is a productive and illustrative tool to identify the most important factors causing the trouble. ConceptDraw PRO extended with Fishbone Diagrams solution from the Management area of ConceptDraw Solution Park is a powerful tool for problem solving with Fishbone Ishikawa diagram graphic method.Venn Diagram Examples for Problem Solving. Environmental Social Science. Human Sustainability Confluence
The Venn diagram example below shows sustainable development at the confluence of three constituent parts. Create your Venn diagrams for problem solving in environmental social science using the ConceptDraw PRO diagramming and vector drawing software extended with the Venn Diagrams solution from the area "What is a Diagram" of ConceptDraw Solution Park.Fishbone Diagram Problem Solving
The Ishikawa diagram, Cause and Effect diagram, Fishbone diagram — all they are the names of one and the same visual method for working with causal connections. Originally invented by Kaoru Ishikawa to control the process quality, the Ishikawa diagram is well proven in other fields of management and personal scheduling, events planning, time management. It is a chart in the form of a fish, whose head is a problem, the fins are variants for its causes. To design easily the Fishbone diagram, you can use a special ConceptDraw PRO vector graphic and diagramming software which contains the powerful tools for Fishbone diagram problem solving offered by Fishbone Diagrams solution for the Management area of ConceptDraw Solution Park.
 Fishbone Diagram
Fishbone Diagrams solution extends ConceptDraw PRO software with templates, samples and library of vector stencils for drawing the Ishikawa diagrams for cause and effect analysis.
Venn Diagrams
Venn Diagrams are the intuitive way to work with sets which allows to visualize all possible logical relations between several sets. They are widely used in mathematics, marketing, logic, statistics, sociology, etc. ConceptDraw PRO diagramming and vector drawing software extended with Venn Diagrams solution from "What is a Diagram" area offers set of useful drawing tools for easy creating the Venn Diagrams for any quantity of sets.
 ConceptDraw Solution Park
ConceptDraw Solution Park collects graphic extensions, examples and learning materials
 Fishbone Diagrams
The Fishbone Diagrams solution extends ConceptDraw PRO v10 software with the ability to easily draw the Fishbone Diagrams (Ishikawa Diagrams) to clearly see the cause and effect analysis and also problem solving. The vector graphic diagrams produced using this solution can be used in whitepapers, presentations, datasheets, posters, and published technical material.
 Mathematics
Mathematics solution extends ConceptDraw PRO software with templates, samples and libraries of vector stencils for drawing the mathematical illustrations, diagrams and charts.
Venn Diagram Template for Word
This template shows the Venn Diagram. It was created in ConceptDraw PRO diagramming and vector drawing software using the ready-to-use objects from the Venn Diagrams Solution from the "What is a Diagram" area of ConceptDraw Solution Park.Software Diagram Templates
Use Software Diagram Templates from the solutions of Software Development area for ConceptDraw PRO to create your own professional looking Software Diagrams in minutes. The Software Diagrams designed with ConceptDraw PRO are vector graphic documents and are available for reviewing, modifying, converting to a variety of formats (image, HTML, PDF file, MS PowerPoint Presentation, Adobe Flash or MS Visio XML), printing and send via e-mail in one moment.Example of Flowchart Diagram
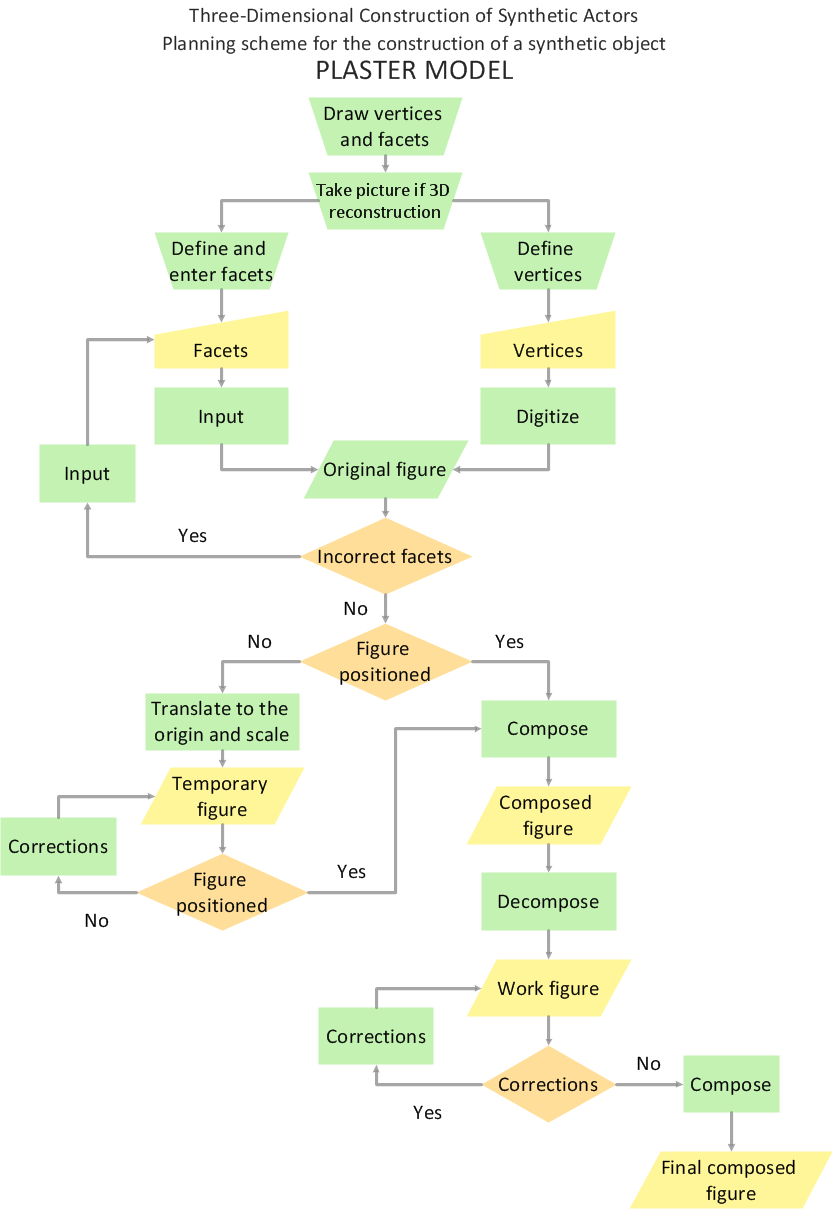
ConceptDraw - feature-rich flowchart software. This software includes flowchart diagram examples set. Libraries contain vector stencils that allow users to use RapidDraw technology. Users can start draw their own flowchart diagrams from existing examples by clicking on direction arrows.
 Management
This solution extends ConceptDraw PRO v9 and ConceptDraw MINDMAP v7 with Management Diagrams and Mind Maps (decision making, scheduling, thinking ideas, problem solving, business planning, company organizing, SWOT analysis, preparing and holding meetings
 Venn Diagrams
Venn Diagrams are actively used to illustrate simple set relationships in set theory and probability theory, logic and statistics, mathematics and computer science, linguistics, sociology, and marketing. Venn Diagrams are also often used to visually summarize the status and future viability of a project.
Venn Diagram Examples for Problem Solving . Quantum Information Science. BQP Complexity
Venn diagrams are illustrations used in the branch of mathematics known as set theory. They show the mathematical or logical relationship between different groups of things (sets). A Venn diagram shows all the possible logical relations between the sets.
 PM Response
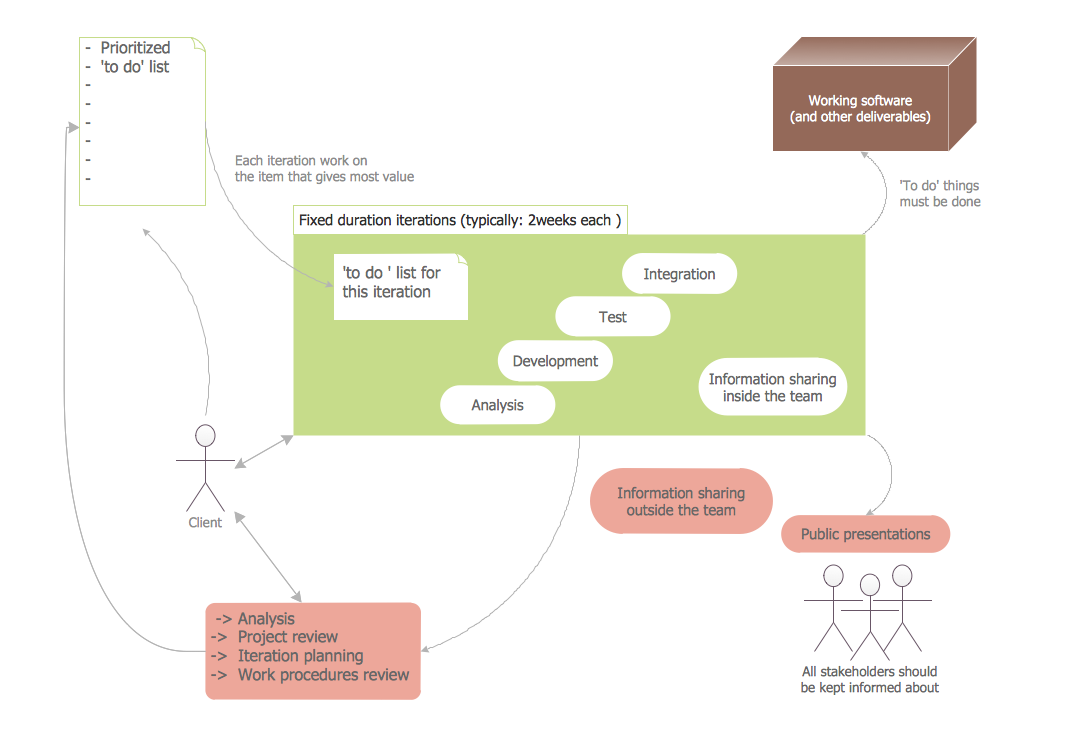
This solution extends all ConceptDraw Office 2.0 products by helping to improve the response time to project changes. PM Response also helps with iteration planning, discussing project layout approaches, and solving project challenges.
- Fishbone Map About Mathematics
- Simple Drawing Applications for Mac | Mathematics | Education ...
- Physics Diagrams | Mathematical Diagrams | Crow's foot ERD ...
- Fishbone Diagram Example Of Math
- Fishbone Diagram | Draw Fishbone Diagram on MAC Software ...
- Fishbone Diagram | Draw Fishbone Diagram on MAC Software ...
- Example Of Fishbone Mapping
- Mathematics | Mechanical Engineering | Using Fishbone Diagram In ...
- Education | Fishbone Diagram | Education Mind Maps | Education ...
- Fishbone Method In Math
- Venn Diagram Examples for Problem Solving. Venn Diagram as a ...
- Fishbone Diagram
- Rapid UML | Physics | Fishbone Diagram | Uml Diagram Example ...
- Physics Diagrams | Fishbone Diagram Problem Solving | Fishbone ...
- Using Fishbone Diagrams for Problem Solving | Venn Diagram ...
- Cause and Effect Analysis - Fishbone Diagrams for Problem Solving ...
- Fishbone Diagram | Fishbone Diagrams | How to Draw a Fishbone ...
- Fishbone Diagram | Venn Diagram Examples for Problem Solving ...
- Fishbone Diagram Based Maths
- Bar Diagram Math | Using Fishbone Diagrams for Problem Solving ...


