 Fishbone Diagrams
The Fishbone Diagrams solution extends ConceptDraw DIAGRAM software with the ability to easily draw the Fishbone Diagrams (Ishikawa Diagrams) to clearly see the cause and effect analysis and also problem solving. The vector graphic diagrams produced using this solution can be used in whitepapers, presentations, datasheets, posters, and published technical material.
Cause and Effect Analysis - Fishbone Diagrams for Problem Solving

 Site Plans
The Site Plans solution extends ConceptDraw DIAGRAM with samples, templates and numerous libraries of design elements making it powerful site plan software, ideal for landscape drawing, designing Site Plans, Site Layout Plans, Landscape Design Drawings, Home Site Plans, Hotel Site Plans, Park Site Plans, for developing the residential and commercial landscape design drawings and site plan, parks planning, landscaping territories, lighting trails, for creating drainage facilities, yard layouts, plant maps, outdoor recreational facilities, and irrigation systems plans.
Fishbone Diagram Problem Solving

Competitor Analysis

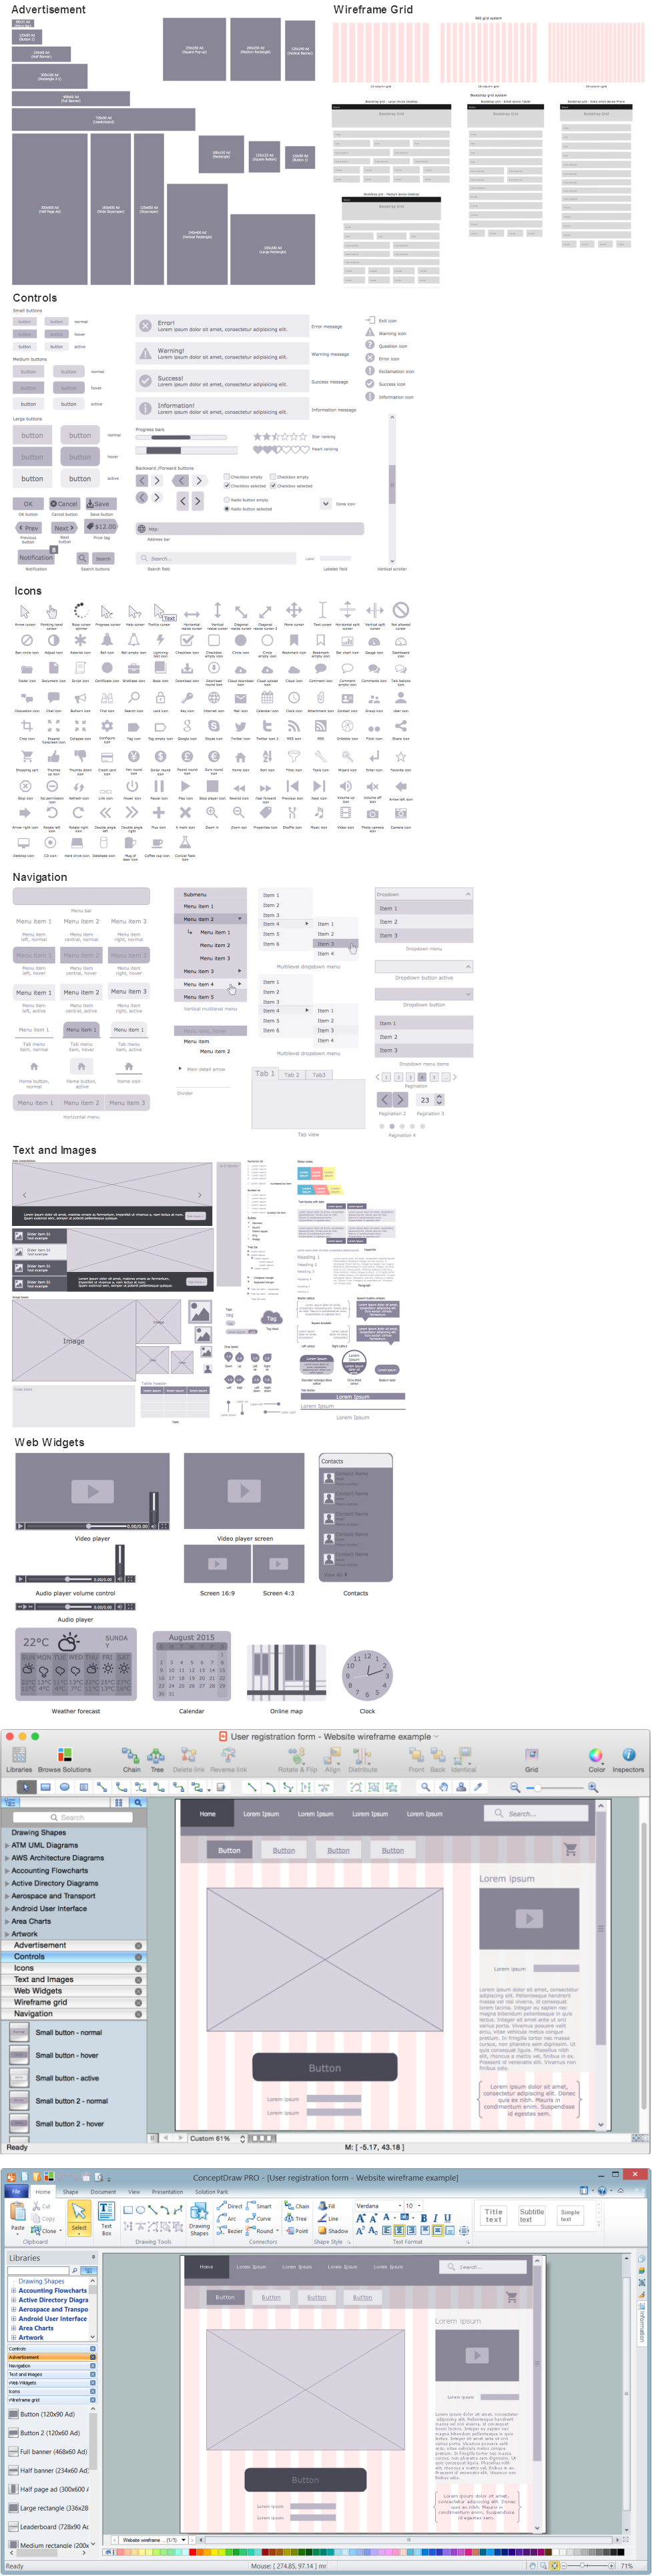
Wireframing
Cause and Effect Analysis


 Pie Charts
Pie Charts are extensively used in statistics and business for explaining data and work results, in mass media for comparison (i.e. to visualize the percentage for the parts of one total), and in many other fields. The Pie Charts solution for ConceptDraw DIAGRAM offers powerful drawing tools, varied templates, samples, and a library of vector stencils for simple construction and design of Pie Charts, Donut Chart, and Pie Graph Worksheets.
SWOT matrix template

 Entity-Relationship Diagram (ERD)
An Entity-Relationship Diagram (ERD) is a visual presentation of entities and relationships. That type of diagrams is often used in the semi-structured or unstructured data in databases and information systems. At first glance ERD is similar to a flowch
- Fishbone Diagrams | Car Parking Causes Fishbone Diagram
- Fishbone Diagrams | Fishbone Diagram | Sample Parking Diagram
- Fishbone Diagram For Parking Lot
- Fishbone Diagram | ConceptDraw Solution Park | Fishbone ...
- Fishbone Diagrams | Event-driven Process Chain Diagrams | Data ...
- ATM UML Diagrams | Fishbone Diagrams | Uml Diagram Park ...
- Fishbone Diagram Problem Solving | How Do Fishbone Diagrams ...
- Fishbone Diagrams | Event-driven Process Chain Diagrams ...
- Data Flow Diagrams (DFD) | Fishbone Diagrams | Dfd Diagram Of ...
- Fishbone Diagram For Less Space Of Cars Parking