HelpDesk
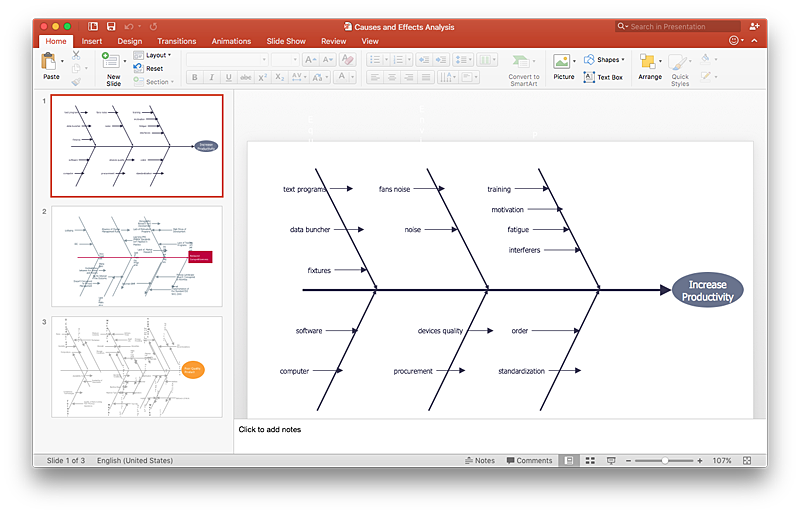
How to Add a Fishbone Diagram to a PowerPoint Presentation Using ConceptDraw PRO
Fishbone (Ishikawa) diagram is often used in business to determine the cause of some problems. The easiest way to draw a Fishbone diagram is using ConceptDraw Fishbone Diagram solution.
 Fishbone Diagram
Fishbone Diagrams solution extends ConceptDraw PRO software with templates, samples and library of vector stencils for drawing the Ishikawa diagrams for cause and effect analysis.
HelpDesk
How to Create a Fishbone (Ishikawa) Diagram Quickly
A Fishbone (Ishikawa) diagram is also called cause-and-effect diagram. Fishbone diagram is often used in business to determine the cause of some problem. The diagram illustrates the main causes and sub-causes leading to an event. The main goal of the Fishbone diagram is to illustrate in a graphical way the relationship between a given outcome and all the factors that influence this outcome. The complete diagram resembles a fish skeleton as its name implies. The ability to create a Fishbone Diagram is supported by the Fishbone Diagram solution. Use ConceptDraw MINDMAP for structuring data and then ConceptDraw PRO for generating a Fishbone Diagram from mind map structure.HelpDesk
How to Draw a Fishbone Diagram with ConceptDraw PRO
Fishbone (Ishikawa) Diagram is often used in business to determine the cause of some problem. A Fishbone diagram is also called cause-and-effect diagram.The main goal of the Fishbone diagram is to illustrate in a graphical way the relationship between a given outcome and all the factors that influence this outcome. The complete diagram resembles a fish skeleton as its name implies. Cause and Effect analysis is used in management to identify the possible causes of a problem in order to eliminate them. The ability to create a Fishbone Diagram is supported by the Fishbone Diagram solution.
 Fishbone Diagrams
The Fishbone Diagrams solution extends ConceptDraw PRO v10 software with the ability to easily draw the Fishbone Diagrams (Ishikawa Diagrams) to clearly see the cause and effect analysis and also problem solving. The vector graphic diagrams produced using this solution can be used in whitepapers, presentations, datasheets, posters, and published technical material.
- Fishbone Diagram Ppt Free Download
- Fishbone Diagram Template Powerpoint Free
- Fishbone Diagram | Presentation Exchange | Entity-Relationship ...
- Fishbone Diagram Powerpoint
- Fishbone Diagram | Business Productivity Diagramming | Business ...
- Fishbone Problem Solving | How to Add a Fishbone Diagram to a ...
- Fishbone Diagram Powerpoint Template
- Fishbone Diagram | Business Productivity Diagramming | Business ...
- Aerospace and Transport | Aerospace - Design Elements | Fishbone ...
- Business Productivity Diagramming | How to Add a Fishbone ...
- Cisco Network Diagram Software | Entity-Relationship Diagram ...
- Fishbone Diagram | Entity-Relationship Diagram (ERD) | SYSML ...
- Fishbone Diagram | Business diagrams & Org Charts with ...
- Aerospace Powerpoint Template
- How To Get Business Brainstorm On Powerpoint Mac
- Ppt Online Education System Uml Diagram
- SWOT Analysis | How to Create Multipage Diagram | Fishbone ...
- Object Diagram Ppt
- Example Of Fishbone Diagram Ppt
- Chart Templates For Powerpoint


