HelpDesk
How to Create SWOT Analysis Template Using ConceptDraw PRO
SWOT-analysis is used to develop a marketing strategy. SWOT-analysis includes determining the strengths and weaknesses in the company's activity, potential external threats and opportunities and assesses their relative strategic competitors. ConceptDraw SWOT and TOWS Matrix Diagrams solution provide a set of SWOT matrix in which should be recorded and then compared the strengths and weaknesses of the enterprise and the market opportunities and threats. This comparison allows you to determine what steps can be taken for the development of your company and what problems need to be addressed urgently.
 Management
This solution extends ConceptDraw PRO v9 and ConceptDraw MINDMAP v7 with Management Diagrams and Mind Maps (decision making, scheduling, thinking ideas, problem solving, business planning, company organizing, SWOT analysis, preparing and holding meetings
 Fishbone Diagram
Fishbone Diagrams solution extends ConceptDraw PRO software with templates, samples and library of vector stencils for drawing the Ishikawa diagrams for cause and effect analysis.
HelpDesk
How to Create a Fishbone (Ishikawa) Diagram Quickly
A Fishbone (Ishikawa) diagram is also called cause-and-effect diagram. Fishbone diagram is often used in business to determine the cause of some problem. The diagram illustrates the main causes and sub-causes leading to an event. The main goal of the Fishbone diagram is to illustrate in a graphical way the relationship between a given outcome and all the factors that influence this outcome. The complete diagram resembles a fish skeleton as its name implies. The ability to create a Fishbone Diagram is supported by the Fishbone Diagram solution. Use ConceptDraw MINDMAP for structuring data and then ConceptDraw PRO for generating a Fishbone Diagram from mind map structure.
 Fishbone Diagrams
The Fishbone Diagrams solution extends ConceptDraw PRO v10 software with the ability to easily draw the Fishbone Diagrams (Ishikawa Diagrams) to clearly see the cause and effect analysis and also problem solving. The vector graphic diagrams produced using this solution can be used in whitepapers, presentations, datasheets, posters, and published technical material.
HelpDesk
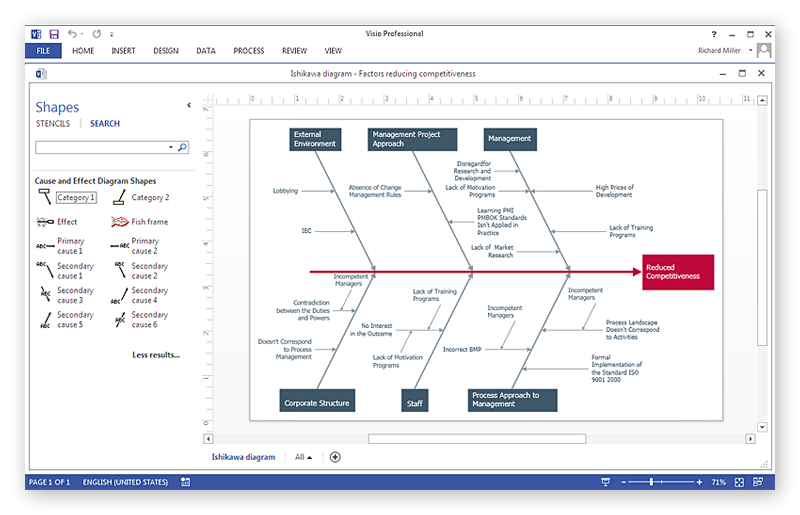
How To Create a MS Visio Cause and Effect Diagram Using ConceptDraw PRO
Cause-and-Effect Ishikawa Diagram is a graphical method of analysis and cause-effect relationships, a tool in the form of fish bone. It is used to systematically determine the cause of the problem and represent it graphically. The technique is primarily used in the framework of quality management for the analysis of quality problems and their causes. Nowadays, it has found worldwide distribution and is used in multiple problem areas. It is one of the tools of lean manufacturing, which is used in group work to find the problems and their causes. ConceptDraw PRO allows you to easily create Fishbone (Ishikawa) diagram and then make a MS Visio VSDX, or VSD files from your diagrams in a couple clicks, using the export capabilities of ConcewptDraw PRO.- New business opportunity SWOT analysis matrix - Template portrait ...
- Process Flowchart | SWOT Sample in Computers | SWOT analysis ...
- SWOT Analysis | TOWS Analysis | Process Flowchart | Fishbone ...
- What is SWOT Analysis? | SWOT analysis matrix diagram templates ...
- Fishbone Diagram | Management | How to Create SWOT Analysis ...
- Marketing | SWOT analysis matrix diagram templates | Fishbone ...
- SWOT Sample in Computers | SWOT Analysis | Fishbone Diagram ...
- SWOT Analysis | Accounting Flowcharts | Fishbone Diagram | Swot ...
- SWOT and TOWS Matrix Diagrams | Fishbone Diagram ...
- Fishbone Diagram | Marketing | SWOT Analysis | Fishbone Analysis ...
- Business Productivity Area | Matrices | SWOT Matrix Template | Fish ...
- Draw Fishbone Diagram on MAC Software | Metro Map | SWOT ...
- Fishbone Diagram | Football | Swot Analysis Example For College
- Fault Tree Analysis Diagrams
- SWOT Analysis | SWOT Sample in Computers | Fishbone Diagram ...
- Draw Fishbone Diagram on MAC Software | How to Make SWOT ...
- Fishbone Diagram | TQM Diagram Tool | SWOT Analysis Software ...
- SWOT Analysis | Fishbone Diagram | Marketing | Examples Of Swot ...
- Fishbone Diagram | Winter Sports | Basketball | A New Business ...


