This site uses cookies. By continuing to browse the ConceptDraw site you are agreeing to our Use of Site Cookies.
HelpDesk

How To Create Cause and Effect (Fishbone) Diagram in MS Visio

Cause-and-Effect Ishikawa Diagram is a graphical method of analysis and cause-effect relationships, a tool in the form of fish bone. It is used to systematically determine the cause of the problem and represent it graphically. The technique is primarily used in the framework of quality management for the analysis of quality problems and their causes. Nowadays, it has found worldwide distribution and is used in multiple problem areas. It is one of the tools of lean manufacturing, which is used in group work to find the problems and their causes. ConceptDraw DIAGRAM allows you to easily create Fishbone (Ishikawa) diagram and then make a MS Visio VSDX, or VSD files from your diagrams in a couple clicks, using the export capabilities of ConcewptDraw DIAGRAM.

ConceptDraw DIAGRAM Compatibility with MS Visio

The powerful diagramming and business graphics tools are now not exception, but the norm for today’s business, which develop in incredibly quick temp. But with the abundance of powerful business diagramming applications it is important to provide their compatibility for effective exchange the information between the colleagues and other people who maybe use different software in their work. During many years Microsoft Visio™ was standard file format for the business and now many people need the visual communication software tools that can read the Visio format files and also export to Visio format. The powerful diagramming and vector drawing software ConceptDraw DIAGRAM is ideal from the point of view of compatibility with MS Visio. Any ConceptDraw DIAGRAM user who have the colleagues that use MS Visio or any who migrates from Visio to ConceptDraw DIAGRAM , will not have any problems. The VSDX (Visio′s open XML file format) and VDX formatted files can be easily imported and exported by ConceptDraw DIAGRAM , you can see video about this possibility.

When To Use a Fishbone Diagram

Fishbone diagrams work for most entrepreneurs and almost any industry or person having a problem. Professional diagramming software may help you create Fishbone (Cause and Effect or Ishikawa) diagrams. When people are unclear about what is causing an issue, ConceptDraw DIAGRAM will be your lifesaver. When to use a Fishbone diagram? Originally developed as a quality control tool, you may find a Fishbone diagram helpful when used in many cases, such as to analyze a complex problem when there are many causes, for identifying all possible root causes for an effect or a problem, when you need different point of view to look on a problem, to uncover bottlenecks and identify where and why a process doesn't work, for acceleration a process when traditional ways of problem solving consume many time.

Draw Fishbone Diagram on MAC Software

The problem solving and decision-making processes are closely linked and crucial for the business and life. There are many tools and techniques for facilitating and improvement these processes, and also enhancement the quality of accepted decisions. One of them is Fisbone Diagram or Cause and Effect diagram. For its construction, you need first define the problem which you need to solve (existing or potential), write it into rectangular and draw to it a horizontal line - a “fish spine”. Then define general types of possible causes like Persons, Materials, Methods, Machinery, Measurements or Environment, and attach them to “spine”. Start brainstorming the possible reasons of failure and connect them to the branches. Professional diagramming ConceptDraw DIAGRAM MAC OSX software offers the Fishbone Diagrams solution which contains templates, samples, and ready Fishbone design objects. Use of them lets effectively identify the possible causes for an effect, realize successfully cause and effect analysis, and instantly draw Fishbone diagram on Mac software.

Cause and Effect Diagrams

Cause and Effect Diagrams are designed to identify the potential factors that cause an overall effect. The causes are grouped into the categories, each cause is a source of variation. ConceptDraw DIAGRAM powerful diagramming and vector drawing software provides the Fishbone Diagrams solution from the Management area of ConceptDraw Solution Park that allows to design the Cause and Effect Diagrams quick, easy and effective.

Is ConceptDraw DIAGRAM an Alternative to Microsoft Visio?

Visio for Mac and Windows - ConceptDraw as an alternative to MS Visio. ConceptDraw DIAGRAM delivers full-functioned alternative to MS Visio. ConceptDraw DIAGRAM supports import of Visio files. ConceptDraw DIAGRAM supports flowcharting, swimlane, orgchart, project chart, mind map, decision tree, cause and effect, charts and graphs, and many other diagram types.

Fishbone Diagram Template
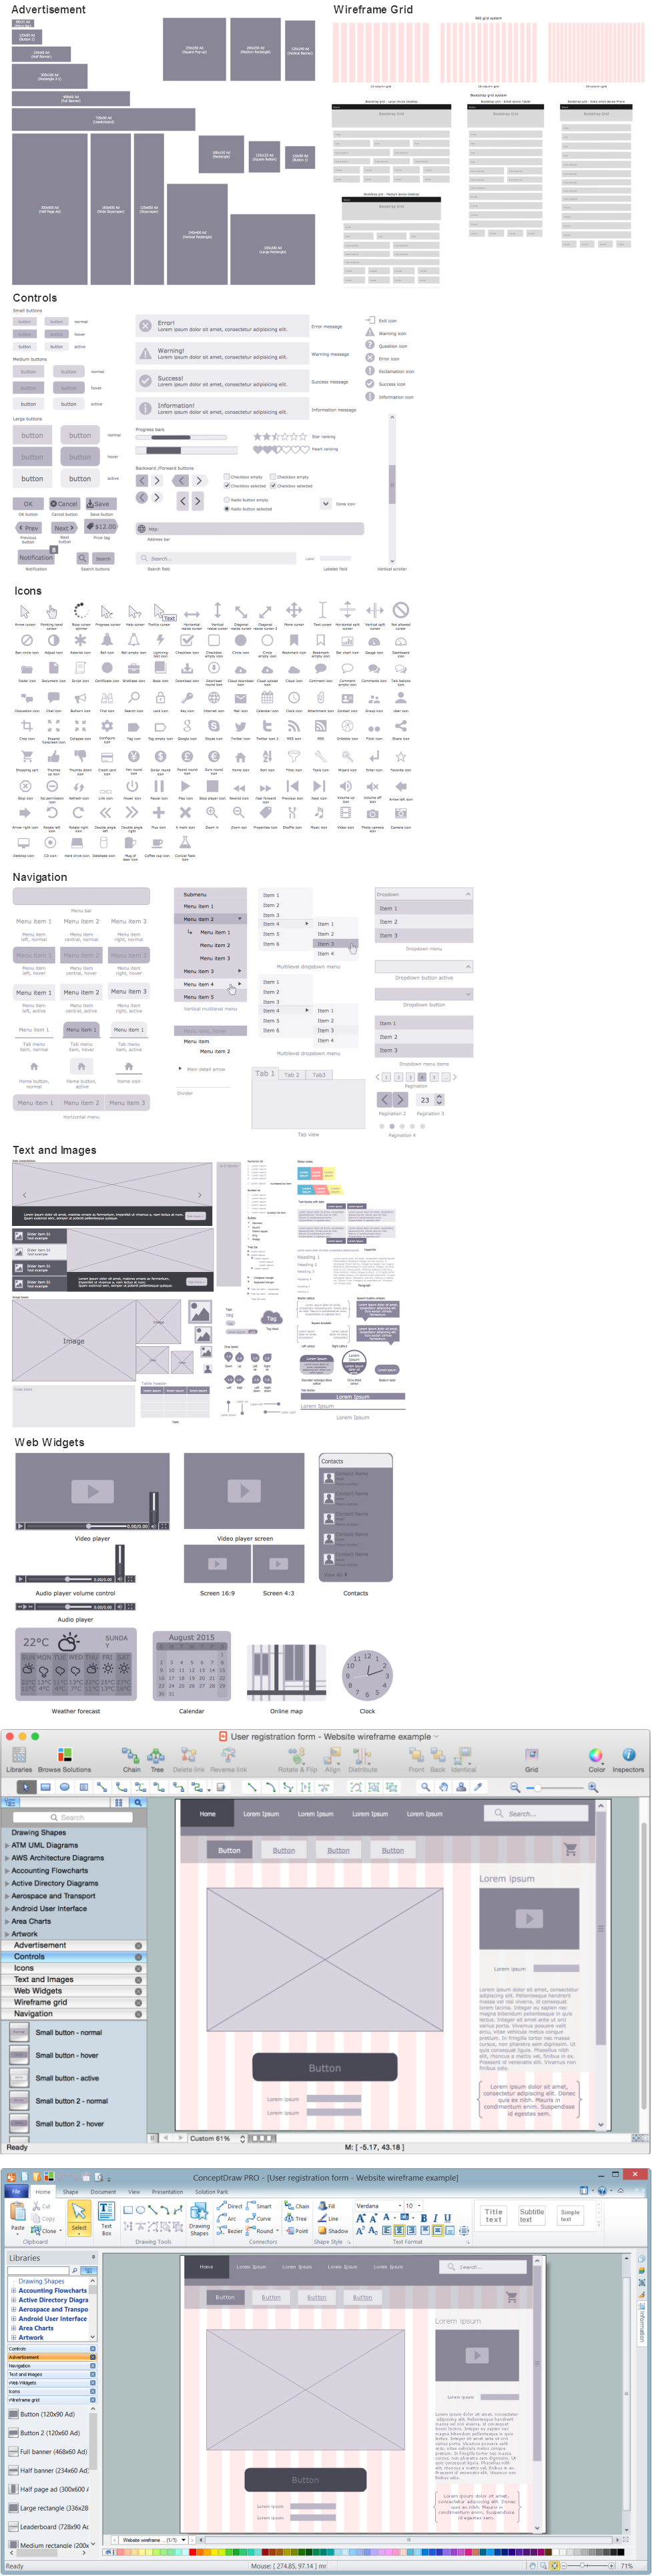
A causal model is an abstract concept, that describes the causal mechanisms of a system, by noting certain variables and their influence on each other, in an effort to discover the cause of a certain problem or flaw. This model is presented in diagram form by using a fishbone diagram. ConceptDraw DIAGRAM diagramming and vector drawing software enhanced with Fishbone Diagrams solution helps you create business productivity diagrams from Fishbone diagram templates and examples, that provide to start using of the graphic method for the analysis of problem causes. Each predesigned Fishbone Diagram template is ready to use and useful for instantly drawing your own Fishbone Diagram.

Wireframing

Website wireframe is a detailed view of design or its skeleton. It shows all the important elements of the final website, the main groups of contents, information structure, describes the user's interaction with interface and its estimated visualisation. ConceptDraw DIAGRAM extended with Website Wireframe solution from the Software Development area is the best wireframing software. Using the wireframe tools, libraries of vector objects, template and examples which offers a Website Wireframe solution, you will easily design the websites wireframes of any complexity.

MS Visio Look a Like Diagrams

No need for any special drawing skills to create professional looking diagrams outside of your knowledge base. ConceptDraw DIAGRAM takes care of the technical details, allowing you to focus on your job, not the drawing. ConceptDraw DIAGRAM delivers full-functioned alternative to MS Visio. ConceptDraw DIAGRAM supports import of Visio files. ConceptDraw DIAGRAM supports flowcharting, swimlane, orgchart, project chart, mind map, decision tree, cause and effect, charts and graphs, and many other diagram types.

Symboles Organigramme

Les organigrammes sont parfaits pour représenter visuellement des processus operationnels. Par exemple, si vous avez besoin d'afficher le flux d'un processus d'ordre personnalisé par l'entremise de divers opérateurs au sein de votre organisation, vous pouvez utiliser un organigramme. Voir aussi d'autres symboles organigramme: Symboles ordinogramme standard, symboles du flux de travail, Vérification Les symboles du schéma fonctionnel, sOrganigramme comptables des symboles, Organigramme de vente des symboles, Symboles pour organigramme des RH, Carte des symboles de processus, Diagramme de processus opérationnels, Symboles utilisés dans le schéma IDEF0.