Use this template to design your five set Venn diagrams.
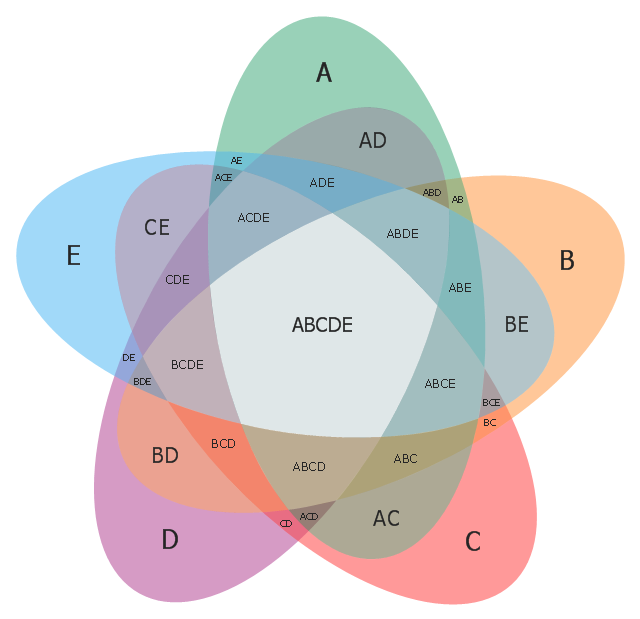
"Five-set Venn diagram using congruent ellipses in a radially symmetrical arrangement devised by Branko Grünbaum. Labels have been simplified for greater readability." [Venn diagram. Wikipedia]
The template "5-set Venn diagram" for the ConceptDraw PRO diagramming and vector drawing software is included in the Venn Diagrams solution from the area "What is a Diagram" of ConceptDraw Solution Park.
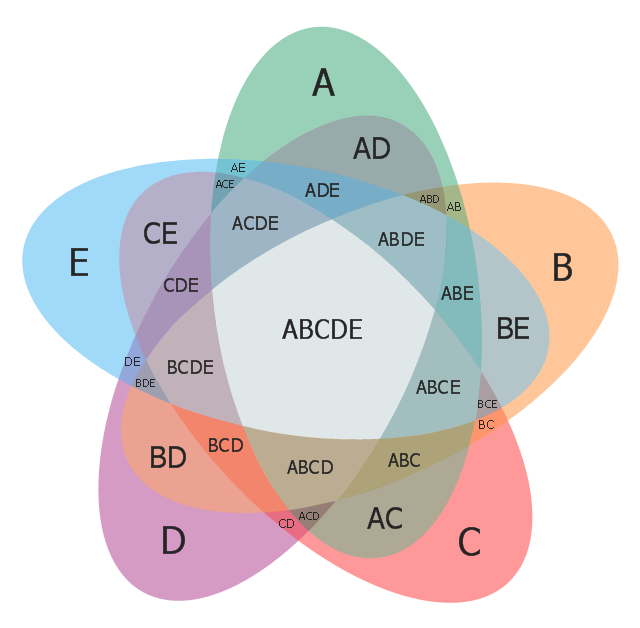
Template
"Five-set Venn diagram using congruent ellipses in a radially symmetrical arrangement devised by Branko Grünbaum. Labels have been simplified for greater readability." [Venn diagram. Wikipedia]
This 5-set Venn diagram template for the ConceptDraw DIAGRAM diagramming and vector drawing software is included in Business Diagrams solution from Management area of ConceptDraw Solution Park.
This 5-set Venn diagram template for the ConceptDraw DIAGRAM diagramming and vector drawing software is included in Business Diagrams solution from Management area of ConceptDraw Solution Park.
Venn diagram
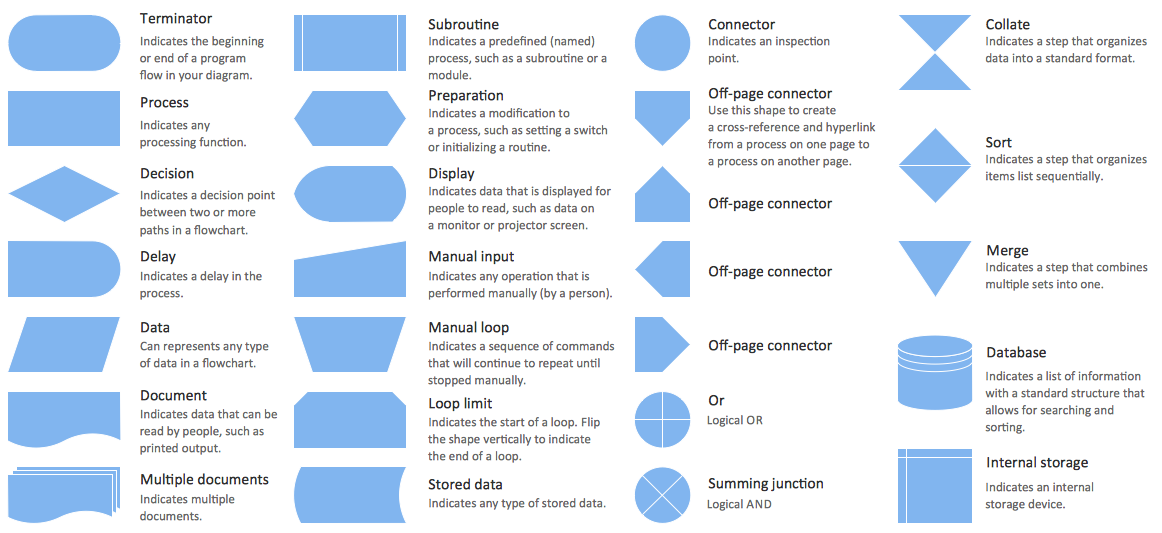
Flow Chart Symbols
Pyramid Diagram

Simple Flow Chart

Data Flow Diagram Symbols. DFD Library

Pyramid Chart Examples

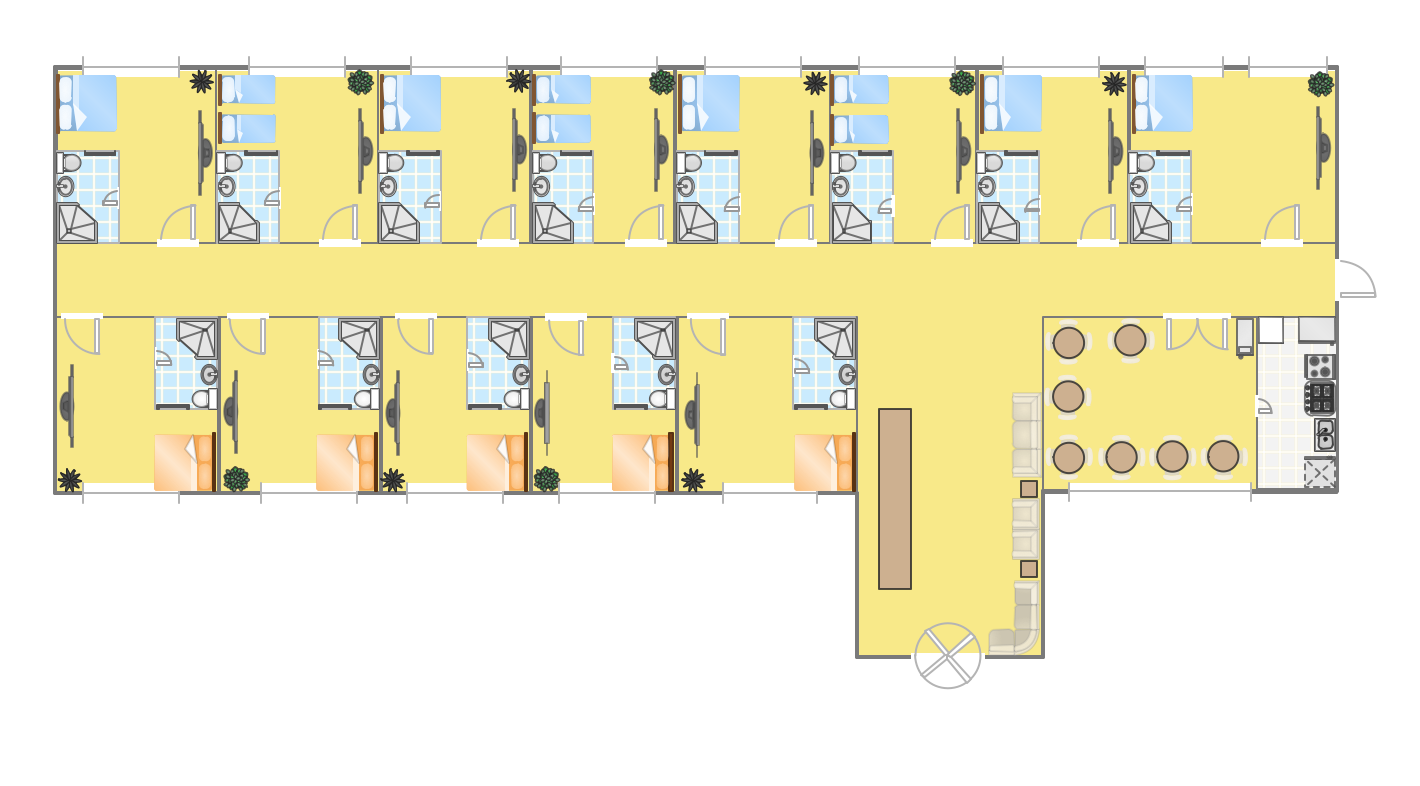
Hotel Plan. Hotel Plan Examples
Entity Relationship Diagram Symbols

 Flowcharts
The Flowcharts solution for ConceptDraw DIAGRAM is a comprehensive set of examples and samples in several varied color themes for professionals that need to represent graphically a process. Solution value is added by the basic flow chart template and shapes' libraries of flowchart notation. ConceptDraw DIAGRAM flow chart creator lets one depict the processes of any complexity and length, as well as design the Flowchart either vertically or horizontally.
- Venn Diagram Template | Venn Diagrams | 5 - Set Venn diagram ...
- 5 - Set Venn diagram - Template | Venn diagrams - Vector stencils ...
- 5 - Set Venn diagram - Template | Wireless Networks | Sets With Five ...
- 5 - Set Venn diagram - Template | Venn Diagram Template | Venn ...
- 5 - Set Venn diagram - Template | 5 -level funnel diagram - Template ...
- Venn Diagrams | 5 - Set Venn diagram - Template | How to Draw a ...
- Venn Diagrams | Venn diagrams - Vector stencils library | Venn ...
- 5 - Set Venn diagram - Template | Venn Diagram Template for Word ...
- Five Circle Venn Diagram Puzzle
- 5 - Set Venn diagram - Template | Venn Diagrams | 5 Way Venn ...