Flow chart Example. Warehouse Flowchart
Warehouse Flowcharts are various diagrams that describe the warehousing and inventory management processes on the warehouses. Typical purposes of Warehouse Flowcharts are evaluating warehouse performance, measuring efficiency of customer service and organizational performance. This type of Workflow diagrams can be used for identifying any disconnection between business activities and business objectives. They are effectively used by warehouse-related people and organizations, manufacturers, wholesalers, exporters, importers, transporters, and others. Standard Warehousing process flow diagram and standard Workflow diagram are used for process identification for further evaluating effectiveness and profitability of overall business process. Use the ConceptDraw PRO vector graphic software extended with Flowcharts solution to design your own professional-looking Workflow diagrams and Flowcharts of any types, including the Warehouse flowchart, Process flow diagrams which depict in details all steps of Warehouse packages flow. Microsoft Visio, designed for Windows users, can’t be opened directly on Mac. But fortunately, there are several Visio alternatives for Mac which will help Mac users to work Visio files. With ConceptDraw PRO, you may open, edit and save files in Visio format.
Flowchart Software
Flowchart is a simple diagram, map or graphical schematic representation the sequence of actions within a process. It is ideal for displaying how a process currently flows or can function ideally. The Flowcharts let define the steps and boundaries of a process, uncover problems or miscommunications. The Flowcharts are widely used in education, software development, business, economics, thanks to their visuality they are ideal for presentations, reports, for using on conferences to help the audience comprehend the content better, or easy find flaws in a process flow diagrams. ConceptDraw PRO is professional flowcharts software and feature-rich flowchart maker, which supports Mac OS X and Windows. It contains at ConceptDraw Solution Park a rich set of stencils and professional flowchart symbols for design. It lets create simply professional-looking Flowcharts based on thousand free flowchart templates, colored symbols and examples. ConceptDraw PRO is a 3 times cheaper alternative to MS Visio available for both Mac and PC. It’s is another full featured business and technical diagramming application that can easily take care of Visio files within OS X. Another bonus with ConceptDraw PRO – it's cross-platform. You can work on a document in both OS X and Windows, skipping Visio entirely.
Create a Flow Chart
Users can start drawing their own flowchart diagrams in fast and simple way with ConceptDraw software.
 Event-driven Process Chain Diagrams
Event-driven Process Chain (EPC) Diagram is a type of flowchart widely used for modeling in business engineering and reengineering, business process improvement, and analysis. EPC method was developed within the Architecture of Integrated Information Systems (ARIS) framework.
This flow chart sample was drawn on the base on the illustration of the article "Climate change impact on China food security in 2050" from the website of Chinese Academy of Agricultural Sciences .
[caas.cn/ en/ newsroom/ research_ update/ 67347.shtml]
"Food security is a condition related to the ongoing availability of food. ...
According to the Food and Agriculture Organization (FAO), food security "exists when all people, at all times, have physical and economic access to sufficient, safe and nutritious food to meet their dietary needs and food preferences for an active and healthy life". ...
Extreme events, such as droughts and floods, are forecast to increase as climate change takes hold. Ranging from overnight floods to gradually worsening droughts, these will have a range of impacts on the agricultural sector. ...
According to the Climate & Development Knowledge Network report Managing Climate Extremes and Disasters in the Agriculture Sectors: Lessons from the IPCC SREX Report, the impacts will include changing productivity and livelihood patterns, economic losses, and impacts on infrastructure, markets and food security. Food security in future will be linked to our ability to adapt agricultural systems to extreme events." [Food security. Wikipedia]
The flowchart example "Food security assessment" was created using the ConceptDraw PRO diagramming and vector drawing software extended with the Flowcharts solution from the area "What is a Diagram" of ConceptDraw Solution Park.
Visual Presentations Made Easy with Diagramming Software
Automatically create a presentation-quality diagram in one click with ConceptDraw PRO.
 Entity-Relationship Diagram (ERD)
Entity-Relationship Diagram (ERD) solution extends ConceptDraw PRO software with templates, samples and libraries of vector stencils from drawing the ER-diagrams by Chen's and crow’s foot notations.
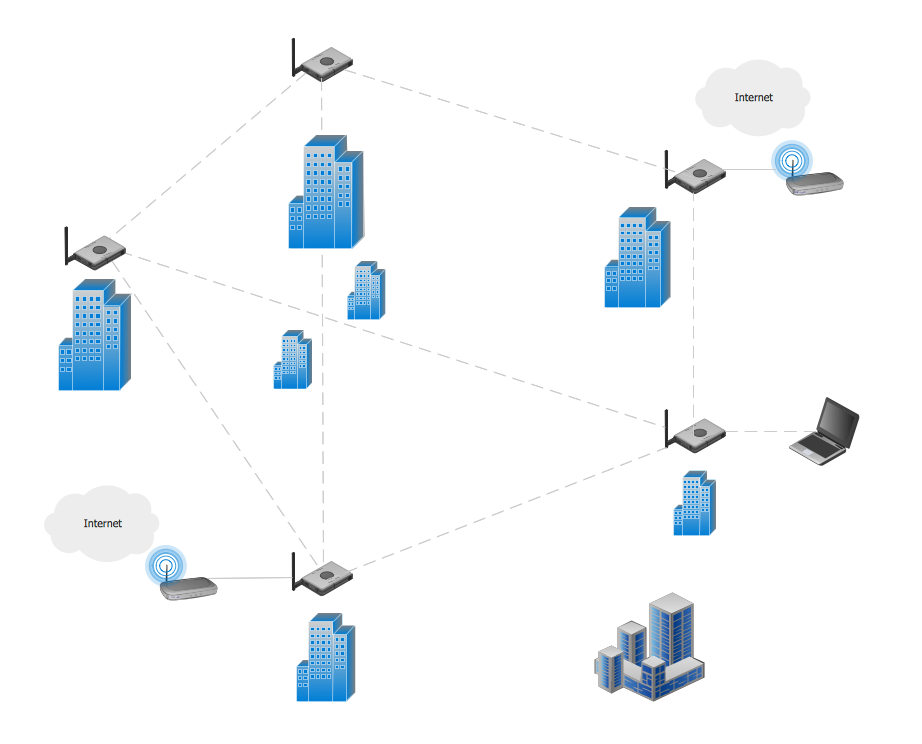
Mesh Network. Computer and Network Examples
A Mesh Topology is a computer network topology that is based on the cells concept, in which each workstation connects with several other workstations of the same network with the possible to accept the switch functions for other workstations. This example was created in ConceptDraw PRO using the Computer and Networks solution from the Computer and Networks area of ConceptDraw Solution Park and shows the Mesh Network.
Drawing Illustration
The Nature Solution addition to ConceptDraw Solution Park for ConceptDraw PRO includes new libraries that provide a wide range nature objects and it can be used in many areas.Venn Diagram Examples for Problem Solving
Venn diagrams are illustrations used in the branch of mathematics known as set theory. They show the mathematical or logical relationship between different groups of things (sets). A Venn diagram shows all the possible logical relations between the sets.Diagrama de Topologia
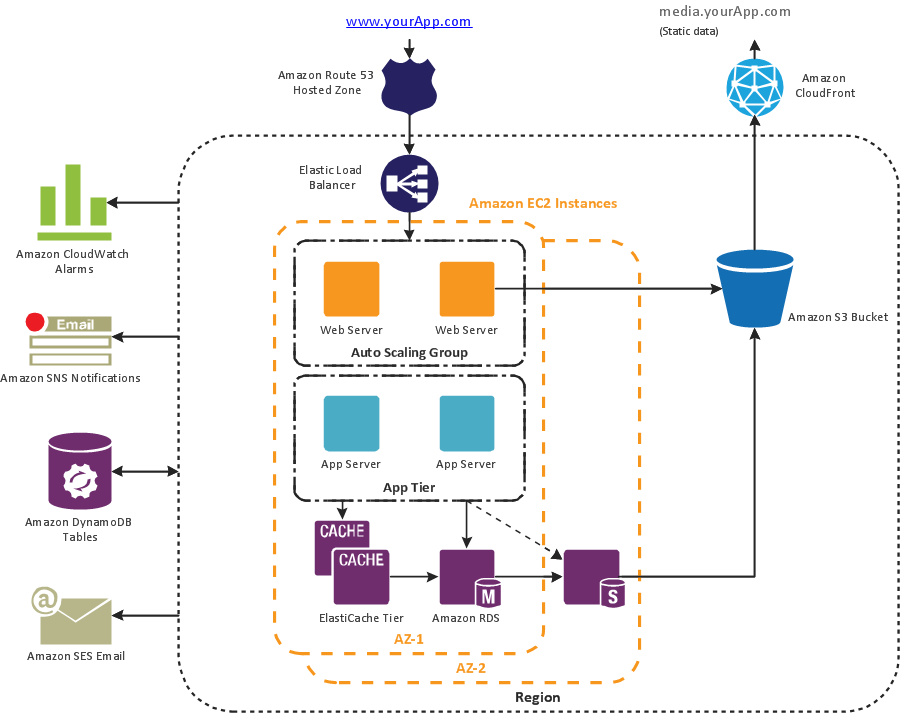
PRO is a powerful drawing tool that changes the way diagrams are produced. ConceptDraw Arrows10 Technology - This is more than enough versatility to draw any type of diagram with any degree of complexity. Diagrama de Topologia or Topology Diagram helps you see the big picture as you develop a service.ConceptDraw PRO Compatibility with MS Visio
The powerful diagramming and business graphics tools are now not exception, but the norm for today’s business, which develop in incredibly quick temp. But with the abundance of powerful business diagramming applications it is important to provide their compatibility for effective exchange the information between the colleagues and other people who maybe use different software in their work. During many years Microsoft Visio™ was standard file format for the business and now many people need the visual communication software tools that can read the Visio format files and also export to Visio format. The powerful diagramming and vector drawing software ConceptDraw PRO is ideal from the point of view of compatibility with MS Visio. Any ConceptDraw PRO user who have the colleagues that use MS Visio or any who migrates from Visio to ConceptDraw PRO, will not have any problems. The VSDX (Visio′s open XML file format) and VDX formatted files can be easily imported and exported by ConceptDraw PRO, you can see video about this possibility.What Is an Action Mind Map
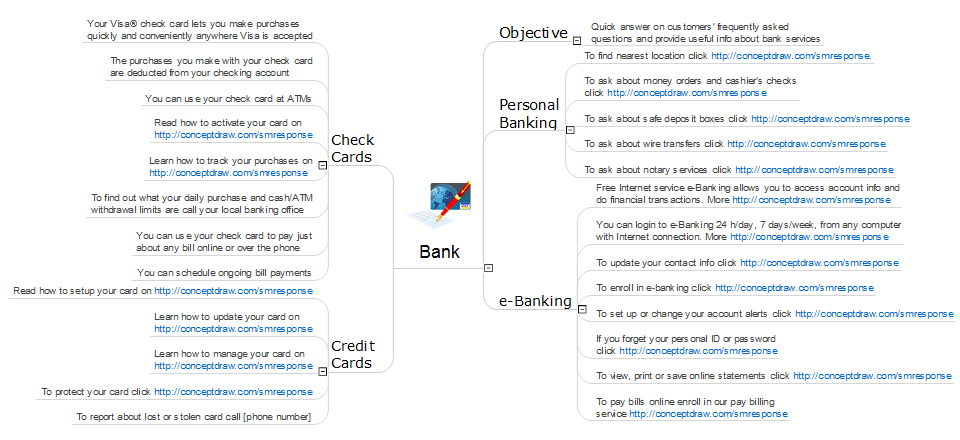
Interactive tool helps you find the appropriate response to social media mentions quickly.Best Value Stream Mapping mac Software
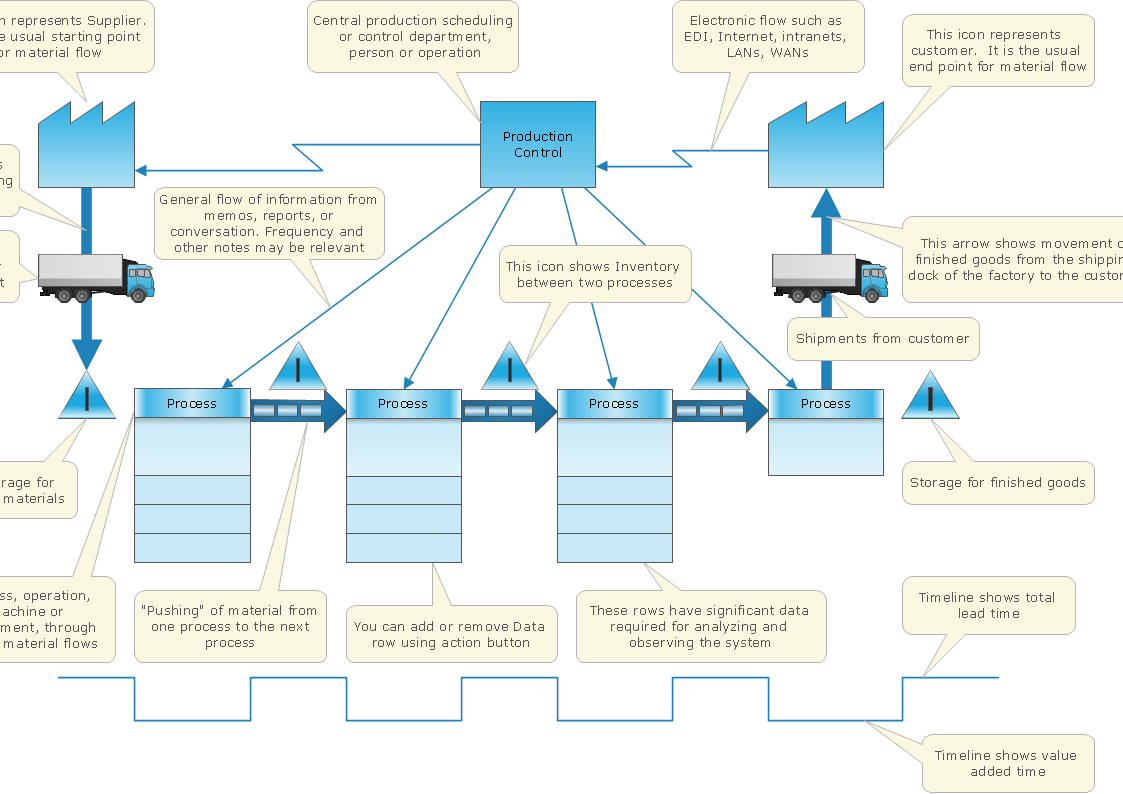
Create value stream maps - for value stream analysis and value stream management, material and information flow mapping, using our quick start templates included with ConceptDraw.ConceptDraw Arrows10 Technology
With ConceptDraw Arrows10 Technology - You can delete a single connector, by using the Delete key. If you need to delete more than a single connector in a complex diagram that contains many relations there is a special Delete Links tool which deletes the connectors only, no other drawing objects are deleted.- What Is The Flow Chart Of Flood With Diagram
- Flood Light Graphical Symbol Digram
- Network Topologies | Routing Flooding Diagram And Explainatio
- Lighting - Vector stencils library | Flow chart Example. Warehouse ...
- Flooding Diagram In Computer Networks
- Flooding Diagram And Concept
- Flood Clip Art Png
- Food security assessment - Flowchart | Flow Chart Symbols ...
- Flood Clipart
- Basic Flowchart Symbols and Meaning | Entity Relationship ...
- Weather - Vector stencils library | Mesh Network Topology Diagram ...
- Food security assessment - Flowchart | Flowcharts | Contoh ...
- Outdoor Flood Lights Drawing Symbol
- Process Flowchart | Electrical Symbols — Logic Gate Diagram ...
- Process Flowchart | Electrical Symbols — Logic Gate Diagram ...
- Process Flowchart | Food security assessment - Flowchart ...
- Process Flowchart | Food security assessment - Flowchart | Flow ...
- Flow Chart Diagram Of A Burglar Alarm System
- Food security assessment - Flowchart | Food Court | Area Charts ...


