Flowcharts are the best for visually representation the business processes and the flow of a custom-order process through various departments within an organization. ConceptDraw DIAGRAM diagramming and vector drawing software extended with Flowcharts solution offers the full set of predesigned basic flowchart symbols which are gathered at two libraries: Flowchart and Flowcharts Rapid Draw. Among them are: process, terminator, decision, data, document, display, manual loop, and many other specific symbols.
The meaning for each symbol offered by ConceptDraw gives the presentation about their proposed use in professional Flowcharts for business and technical processes, software algorithms, well-developed structures of web sites, Workflow diagrams, Process flow diagram and correlation in developing on-line instructional projects or business process system. Use of ready flow chart symbols in diagrams is incredibly useful - you need simply drag desired from the libraries to your document and arrange them in required order.
There are a few serious alternatives to Visio for Mac, one of them is ConceptDraw DIAGRAM. It is one of the main contender with the most similar features and capabilities.
Business process modeling is known in the corporate world as an excellent tool which can speak. Business process flowcharts, diagrams and maps are used to define the business processes in terms of inputs and outputs, to visually represent and effectively explain complex business processes of an enterprise, and also showcase decisions on a single piece of paper. The process of business process mapping supposes the use of special business process flowchart symbols predefined by Business Process Modeling Notation (BPMN) and taking their roots from the data processing diagrams and programming flow charts. In other words the BPMN standard notation is a common language used for business process design and implementation, that guarantees a clarity of designed Business Process Flowcharts for all business analysts, technical developers and business managers.
The ability to create professionally-looking Business Process flowcharts, maps and diagrams, is provided by powerful ConceptDraw DIAGRAM software and the Business Process Mapping solution included to ConceptDraw Solution Park.
Data Flow Diagram (DFD) is the part of the Structured Systems Analysis and Design Methodology (SSADM), which is intended for information systems projection and analysis. Data Flow Diagrams allow graphically represent the data flows in information system and analyze the data processing during the structural projection. This type of diagrams lets visually show a work of information system and results of this work, it is often used in connection with human processes and can be displayed as Workflow diagram. Data Flow Diagram visualizes processes and functions, external entities, data depositories, and data flows connecting these elements and indicating direction and data character. Each of these elements used for DFD has its own graphical notation. There are two notations to draw DFDs - Yourdon & Coad and Gane & Sarson.
ConceptDraw DIAGRAM extended with Data Flow Diagrams (DFD) solution from Software Developmant area is ideal for designing professional looking DFDs, which can be then easily exported in various formats.
Accounting information is a system of interrelated processes which represent financial and accounting data, required for decision making. For representing the accounting processes in a visual and easy for perception form are constructed Accounting Flowcharts. For their creation are used special flowchart symbols, this makes Accounting flowcharts understandable for all users of accounting information system and helps them easy understand the sequence of steps involved to accounting processes.
But how to create Flowcharts for an Accounting Information System fast and easy? Use of special design software is useful for this. ConceptDraw DIAGRAM software extended with Accounting Flowcharts solution is the best for creation accurate Accounting Flowcharts, for documentation and visually communication on how accounting processes work, how each operation is done. Accounting Flowcharts solution is supplied with library of predesigned commonly used vector symbols, Accounting Flowchart templates and samples demonstrating receiving, purchasing, payment, and other accounting processes.
The audit is a complex process consisting of defined quantity of steps, which have as a final goal the ensuring of success of a certain business project. It includes the independent examination of data, statements and financial performances of an enterprise for a stated purpose. It is convenient to construct the Audit Flowcharts or Audit Diagrams for visual representation and structuring the audit processes.
ConceptDraw DIAGRAM diagramming software enhanced with Audit Flowcharts solution from the Finance and Accounting area of ConceptDraw Solution Park effectively helps to draw the Audit Diagrams for accounting, finance and money management, the Audit Flowcharts for fiscal information tracking, financial inventories and documenting Six Sigma, the decision making Flow Charts, etc. This solution provides the powerful drawing tools, numerous templates and samples, and large quantity of vector audit flowchart symbols that greatly facilitate the process of representation the audit steps and audit results, and designing efficient and visually appealing Audit Flowcharts.
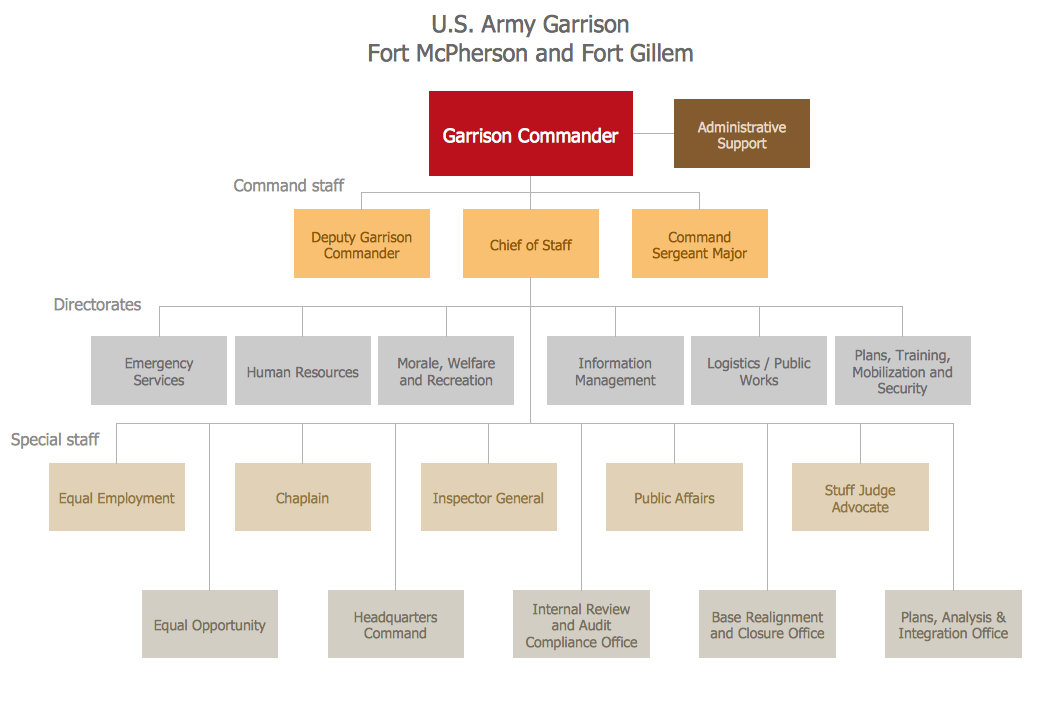
Matrix organizational structure is one of the main forms of structures which is actively used by organizations to carry forth the functions of a company visually and effectively.
Now we have ConceptDraw DIAGRAM diagramming and vector drawing software extended with 25 Typical Orgcharts solution from the Management area of ConceptDraw Solution Park which will help easy represent matrix organizational structure of any degree of complexity.
Use of Cross-Functional Flowchart is a clear way of showing each team member’s responsibilities and how processes get shared or transferred between different responsible people, teams and departments. Use the best flowchart maker ConceptDraw DIAGRAM with a range of standardized cross-functional flowchart symbols to create the Cross-Functional Flowcharts simply and to visualize the relationship between a business process and the functional units responsible for that process.
To draw the most quickly Cross-Functional Flowcharts, Cross Functional Process Maps, or Cross Functional Process Flow Diagrams, start with a Cross-functional flowchart samples and templates from ConceptDraw Solution Park. The ConceptDraw Arrows10 and RapidDraw technologies will be also useful for you in drawing. ConceptDraw DIAGRAM supports designing both types - horizontal and vertical Cross-functional flowcharts. A vertical layout makes the accents mainly on the functional units while a horizontal layout - on the process.
If you need a Visio alternative in Mac OS X, try ConceptDraw DIAGRAM. Its interface is very intuitive and it’s actually much easier to use than Visio, yet somehow it’s just as powerful if not more so. ConceptDraw DIAGRAM performs professional quality work and seamless Visio interaction.
How to Draw a Cross Functional Flowchart using visio alternative ConceptDraw DIAGRAM as visio for mac
Chemical and Process Engineering Solution from the Industrial Engineering Area of ConceptDraw Solution Park is a unique tool which contains variety of predesigned process flow diagram symbols for easy creating various Chemical and Process Flow Diagrams in ConceptDraw DIAGRAM.
ConceptDraw DIAGRAM diagramming and vector drawing software extended with 25 Typical Orgcharts solution from the Management area of ConceptDraw Solution Park offers 25 ready Organization Chart templates, 10 samples and 2 libraries with predesigned vector objects.
If neither of 45 vector shapes of the Cross-Functional Flowcharts solution don't fit your needs, you will want to learn How to create a unique Cross-Functional flowchart.
ConceptDraw Arrows10 Technology - This is more than enough versatility to draw any type of diagram with any degree of complexity.
Drawing software lets you to make horizontal and vertical, audit, opportunity and many more flowcharts.