Financial Comparison Chart
This sample shows the Bar Chart of the leverage ratios for two major investment banks. The leverage ratio is the ratio of the total debt to the total equity; it is a measure of the risk taken by the bank. The higher of the leverage ratio denotes the more risk, the greater risks can lead to the subprime crisis.Purchasing Flow Chart. Purchasing Flowchart Example
This sample shows the Purchasing Flow Chart Diagram that displays the money flow in the carbon offset sphere. The carbon offsets are the compensatory measures that the companies make for the carbon emissions. You can see on this sample the groups that have interests in the carbon offsets and the money flow after the carbon offset vendors sold the carbon offsets.Rainfall Bar Chart
This sample shows the Horizontal Bar Chart of the average monthly rainfalls. This sample was created in ConceptDraw PRO diagramming and vector drawing software using the Bar Graphs Solution from the Graphs and Charts area of ConceptDraw Solution Park.Column Chart Examples
Column chart examples from ConceptDraw collection can help you find the best visual depiction for you data. You can easily modify column chart examples according to data you want to visualize.Sales Growth. Bar Graphs Example
This sample was created in ConceptDraw PRO diagramming and vector drawing software using the Bar Graphs Solution from Graphs and Charts area of ConceptDraw Solution Park. It is Bar Graphs example, Sales Growth example, Column Chart Example - Sales Report.Feature Comparison Chart Software
An example of marketing analysis diagram, can be used to analyse product market and define marketing strategy. This sample shows the Feature Comparison Chart of the digital scouting cameras. It can be useful for digital cameras production field, marketing, sales, etc.Bar Chart Template for Word
All these bar chart templates are included in the Bar Graphs solution. You can quickly rework these bar graph templates into your own charts by simply changing displayed data, title and legend texts.Risk Diagram (Process Decision Program Chart)
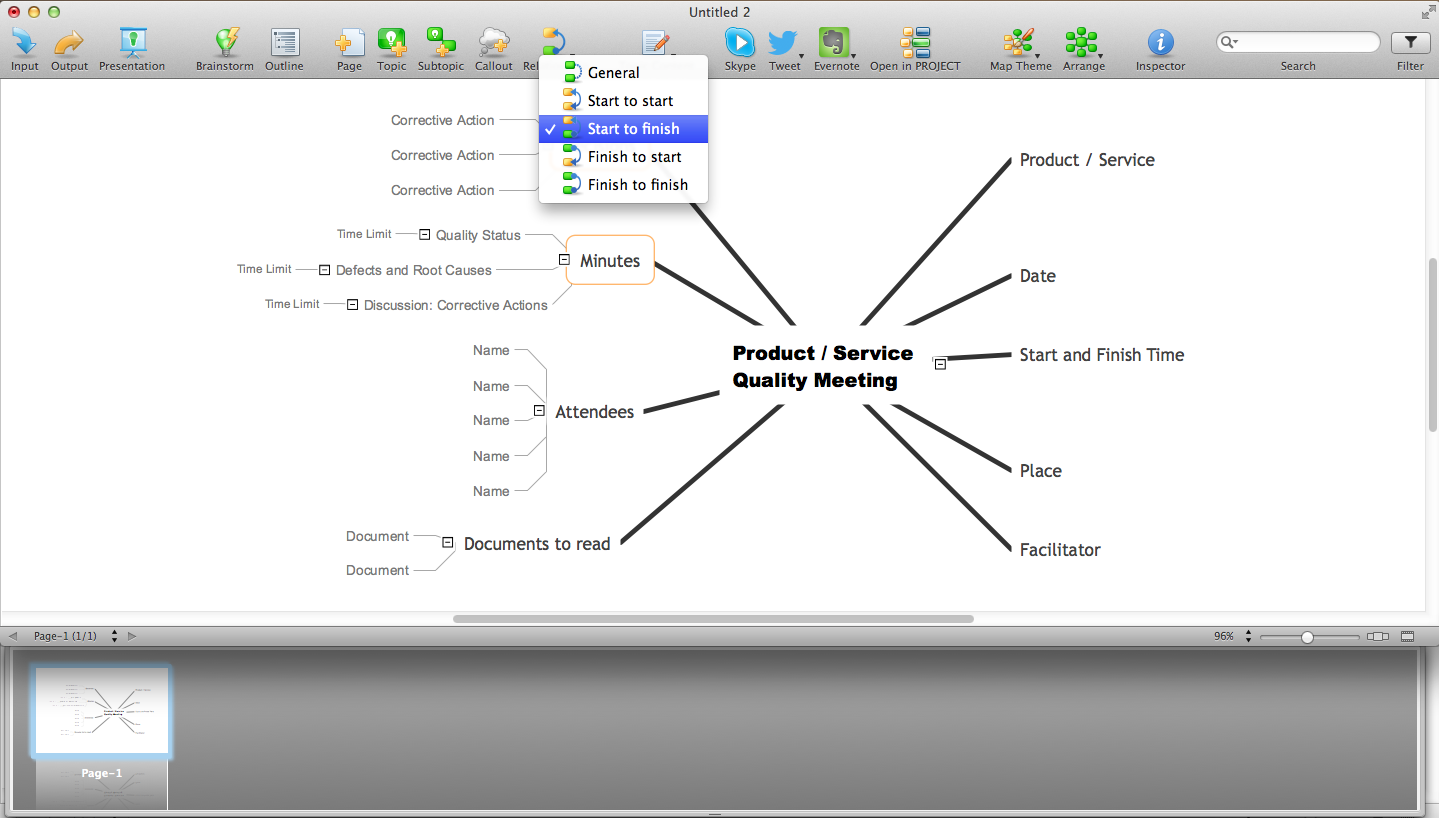
The risk is a probable event in result of which may occur the negative events and adverse consequences. The risk management is a very important process in any field, it is a process of making the management decisions aimed on the reducing the likelihood of appearing the unfavorable results and on the minimizing potential losses, as well as the implementation of these solutions. The main purpose of applying the risk management is increasing of enterprise's competitiveness with help of protection against the risks. ConceptDraw MINDMAP software is perfect for identifying the risks, analyzing and managing risks, for designing Risk Diagrams, for developing effective actions in response to circumstances and potential obstacles that were identified as risks. It is also the best for designing Process Decision Program Charts and representing the PDPC method, which is effective way of detailed planning and depiction the whole sequence of actions on the path from the formulation a problem to its solution. The PDPC lets determine the risks when corrective actions are not performed correctly and helps develop descriptions for preventive actions.Why People Select ConceptDraw MINDMAP
Why people select ConceptDraw MINDMAP? Undoubtedly it is the best alternative to MindJet MindManager. Among the advantages of ConceptDraw MINDMAP are: powerful and unique tools for brainstorming, outlining, taking notes, making detailed Mind Maps and relationship maps; the personal license that gives the ownership on the product for the product's life and allows a concurrent Mac and Windows installation; the absence of obligatory subscription on renewal; regularly updates with new features, templates and low upgrade costs; free technical support and better service for a lower cost. Besides, ConceptDraw MINDMAP provides the operating system migration and compatibility with other ConceptDraw products. It is a cross-platform software for the use on Mac and Windows machines simultaneously according to your preferences. The opening of ConceptDraw MINDMAP document in ConceptDraw PROJECT application turns the outline into a project, now you can add resources and due dates, edit the tasks to make a robust and easily-deciphered project. Discover today what these benefits mean to you.
 Presentation Exchange
This solution extends ConceptDraw MINDMAP software with the ability to import presentations from Microsoft PowerPoint, as well as enhancing its existing presentation capabilities.
 Business Productivity Area
Business Productivity Solutions extend ConceptDraw products with tools for making presentations, conducting meetings, preparing documents, brainstorming, or building new strategies.
 Project Management Area
Project Management area provides Toolbox solutions to support solving issues related to planning, tracking, milestones, events, resource usage, and other typical project management functions.
3 Ways to Quickly Create Excellent Presentations
When you decide to represent data without spending lots of time you can effectively generate, change, and update your presentation to best meet your needs with ConceptDraw MINDMAP.
 Marketing Diagrams
This solution extends ConceptDraw PRO with samples, templates and library of design elements for drawing the marketing diagrams.
- Process Flowchart | Basic Audit Flowchart . Flowchart Examples ...
- Flow Chart Of Leverage
- Flowchart Example: Flow Chart of Marketing Analysis | Marketing ...
- Sales Growth. Bar Graphs Example | Business Report Pie. Pie Chart ...
- Pie Chart Bar Chart Flow Chart Define
- Flowchart on Bank. Flowchart Examples | Purchasing Flow Chart ...
- Leverage Analysis Flowcharts
- Process Flowchart | Financial Comparison Chart | Positioning Map ...
- How To Explain A Marketing Pie Chart Bar Chart
- Bar Chart Template for Word | Bar Chart Examples | Rainfall Bar ...
- Marketing and Sales Organization chart . Organization chart Example
- Purchasing Flow Chart . Purchasing Flowchart Example | Financial ...
- Create Graphs and Charts | Financial Comparison Chart | Process ...
- Conversion Of Graphics And Pie Chart Table And Flow Bar Chart
- Rainfall Bar Chart | Financial Comparison Chart | Bar Chart ...
- CORRECTIVE ACTIONS PLANNING. Risk Diagram (PDPC) | The ...
- Financial Comparison Chart | Bar Diagrams for Problem Solving ...
- Logistics Flow Charts | Financial Comparison Chart | Economic ...
- Business Report Pie. Pie Chart Examples | Pie Chart | Create ...
- Financial Comparison Chart | Sales Growth. Bar Graphs Example ...


