IDEF0 Flowchart Symbols
The modeling of business and business processes is not quite a simple process for both small-size businesses and large businesses. The IDEF0 method is one of the popular and easy methods of modeling the business as a complex system. It is based on the functional modeling language Structured Analysis and Design Technique (abbr. SADT) and is concentrated on the activity modeling. According to this method are constructed the IDEF0 Diagrams and IDEF0 Flowcharts, which are succesfully used not only for documenting the business, but also for analysis, development, integration of information and software systems, reengineering, etc. This method suggests the use of special IDEF0 Flowchart Symbols from the IDEF0 notation for construction the IDEF0 Flowcharts. ConceptDraw DIAGRAM diagramming and vector graphic software extended with IDEF0 Diagrams solution from the Software Development area of ConceptDraw Solution Park is rich for the powerful drawing tools, built-in templates and samples, and predesigned IDEF0 flowchart symbols.Structured Systems Analysis and Design Method. SSADM with ConceptDraw DIAGRAM
Structured Systems Analysis and Design Method (abbr. SSADM) is a method developed in Great Britain and accepted in 1993 as a national standard for information systems development and analysis. SSADM is based on Data Flow Diagrams and is characterized with presence of clear sequence of steps at projecting, analysis, and documenting of information system. It involves 6 main stages: analysis of existing system or estimation of practicability, requirements definition, determination of technical requirements and equipment cost, development of logical data model, projecting of logical requirements and specification them, physical projecting. Each of them is also divided into several steps defining the tasks that should be fulfilled at a given stage. The most important SSADM elements are flows modeling with help of DFD, data logic modeling with help of LDS (Logical Data Structure) and description of entities behavior. Applying of SSADM is easy with ConceptDraw DIAGRAM diagramming and vector drawing software and Data Flow Diagram solution.Basic Network Diagram
The Basic Network Diagram is an easy and effective way to design and document a simple network, it lets to represent visually and logically how the different network devices and computer equipment can be installed to meet the main business needs. ConceptDraw DIAGRAM software supplied with Computer Network Diagrams solution from the Computer and Networks area of ConceptDraw Solution Park is a perfect tool for drawing the Basic Computer Network diagrams, designs, schematics, and maps, network architectures, topologies, and layouts. Numerous vector libraries of network symbols, icons and components are incredibly helpful for IT and telecom engineers, stakeholders and end-users when designing Basic Network Diagrams, Common Network Diagrams, Common Network Topologies, 10Base-T Star Network Topologies, Bus Topology Diagrams, Communication Network Diagrams, System Designs, Regional Cable Head-End Diagrams, etc. Collection of predesigned samples and templates included to Computer Network Diagrams solution also greatly extends the capabilities of ConceptDraw DIAGRAM users.
Design Element: Computer and Network for Network Diagrams
There are many types of computer networks, they differ in size, topology, organizational intents, in transmission medium used to carry the signals, in communication protocols to organize network traffic, and in many other parameters. Computer Network Diagrams help to visualize schematically computer networks and computer network topologies, equipment nodes, as well as different types of their logical and physical connections. ConceptDraw DIAGRAM is a perfect network diagramming software intended for network designers and software developers who need to draw different types of Computer Network Diagrams. Computer Network Diagrams solution from the Computer and Networks area of ConceptDraw Solution Park provides for ConceptDraw DIAGRAM users a lot of computer network design elements helpful for visualization varied ideas regarding to design and implementation of computer and telecommunication networks, LAN, MAN and WAN architectures, physical and logical topologies, wiring schematics and cabling layout plans.
 Cisco Network Diagrams
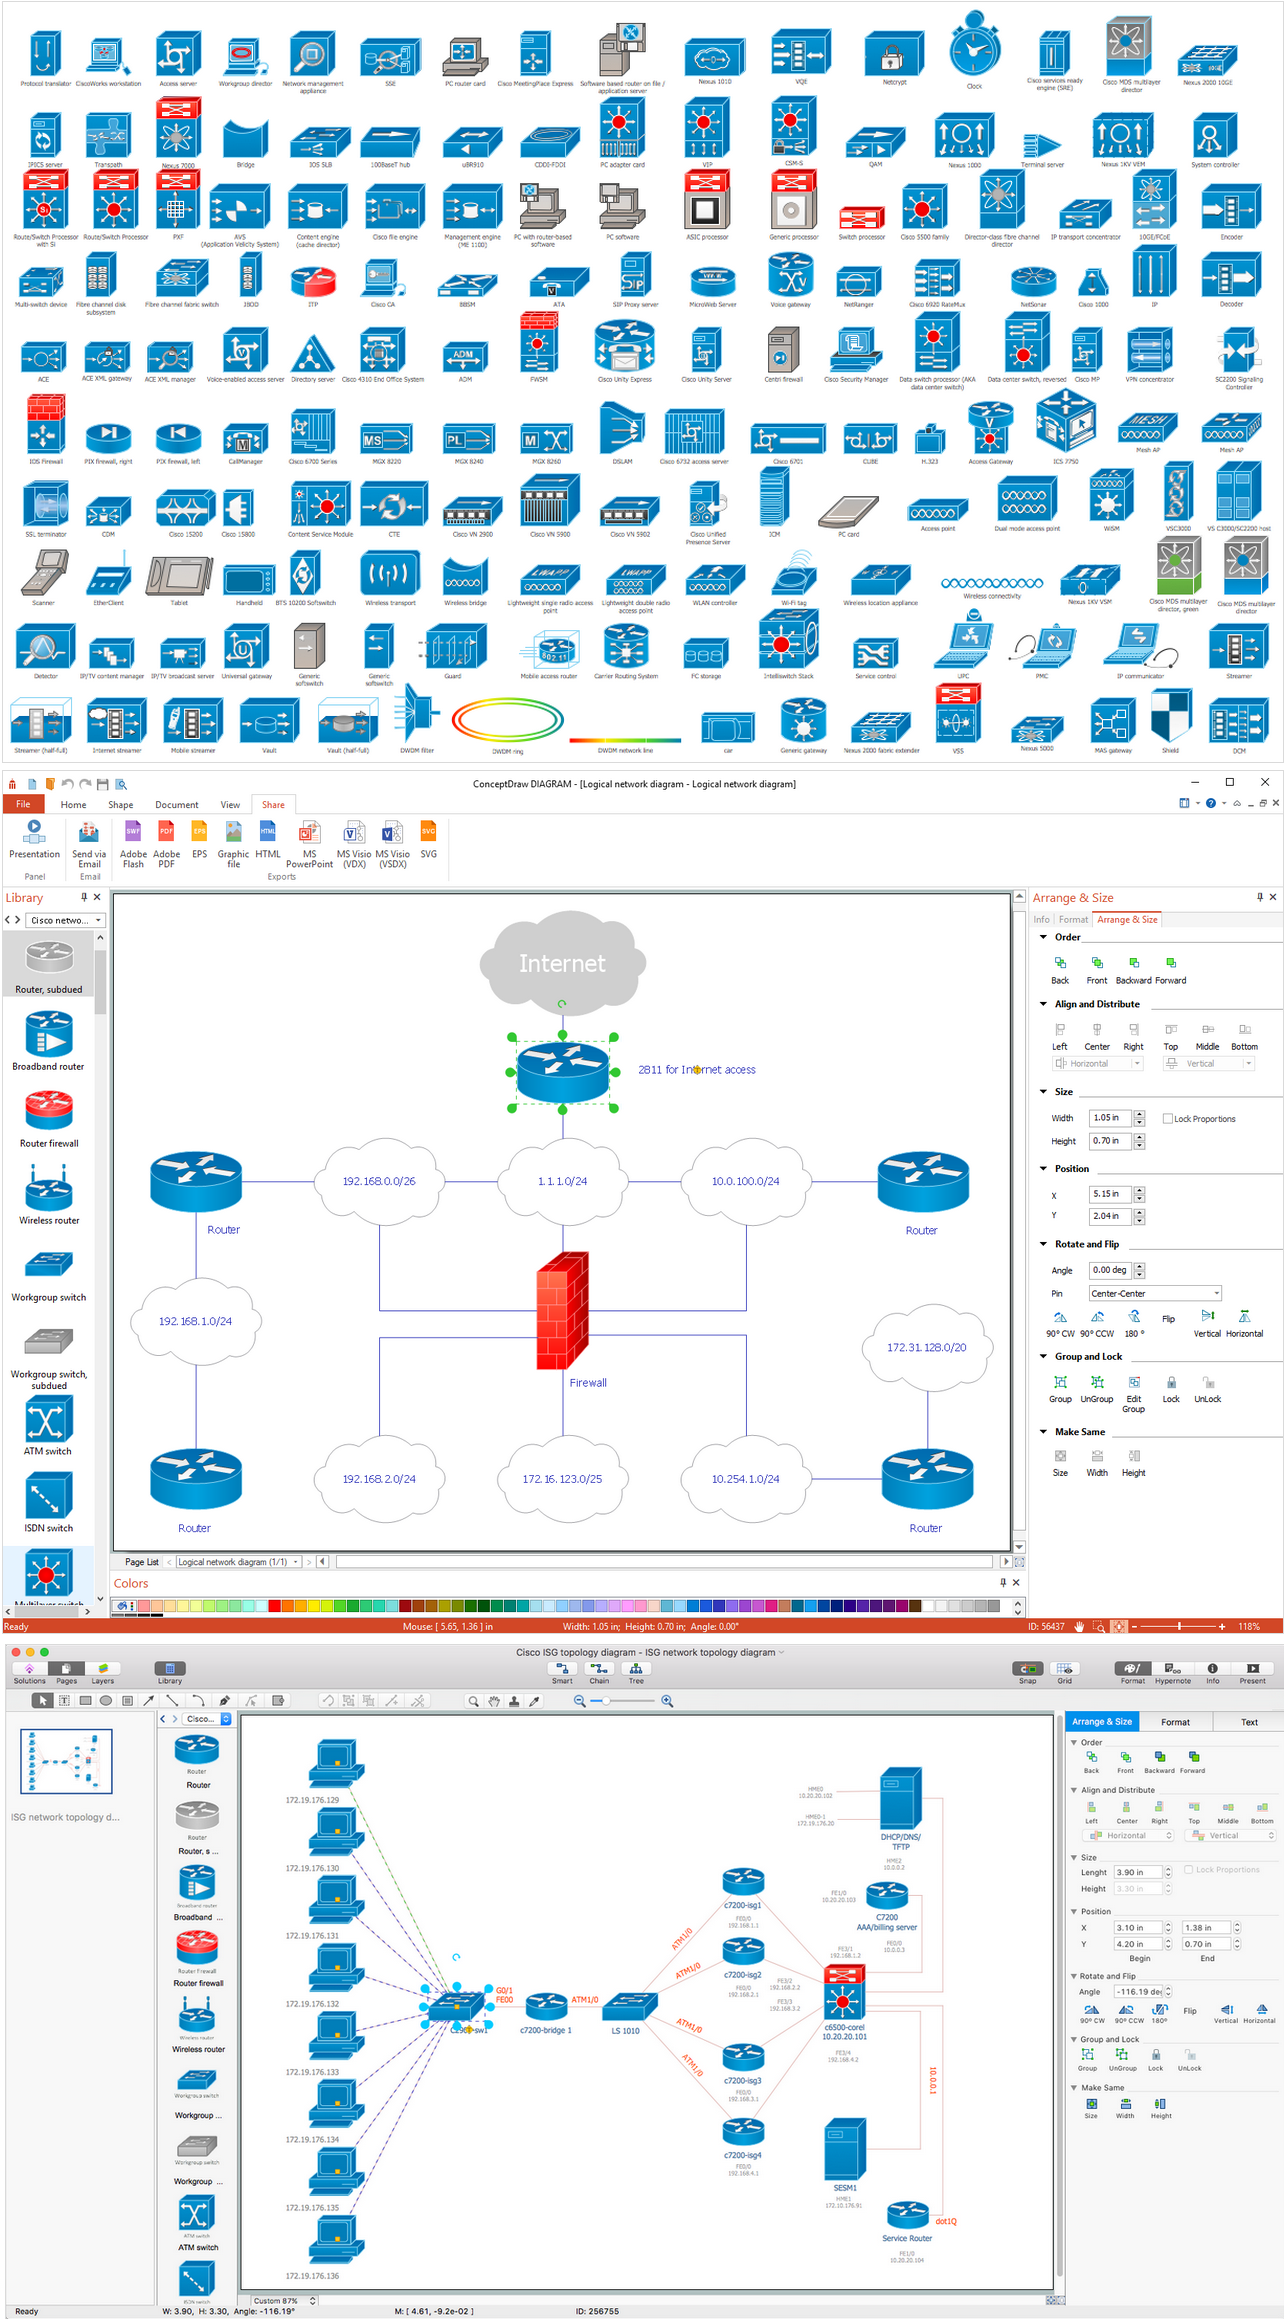
Cisco Network Diagrams solution extends ConceptDraw DIAGRAM with the best characteristics of network diagramming software. Included samples, templates and libraries of built-in standardized vector Cisco network icons and Cisco symbols of computers, network devices, network appliances and other Cisco network equipment will help network engineers, network designers, network and system administrators, as well as other IT professionals and corporate IT departments to diagram efficiently the network infrastructure, to visualize computer networks topologies, to design Cisco computer networks, and to create professional-looking Cisco Computer network diagrams, Cisco network designs and schematics, Network maps, and Network topology diagrams in minutes.
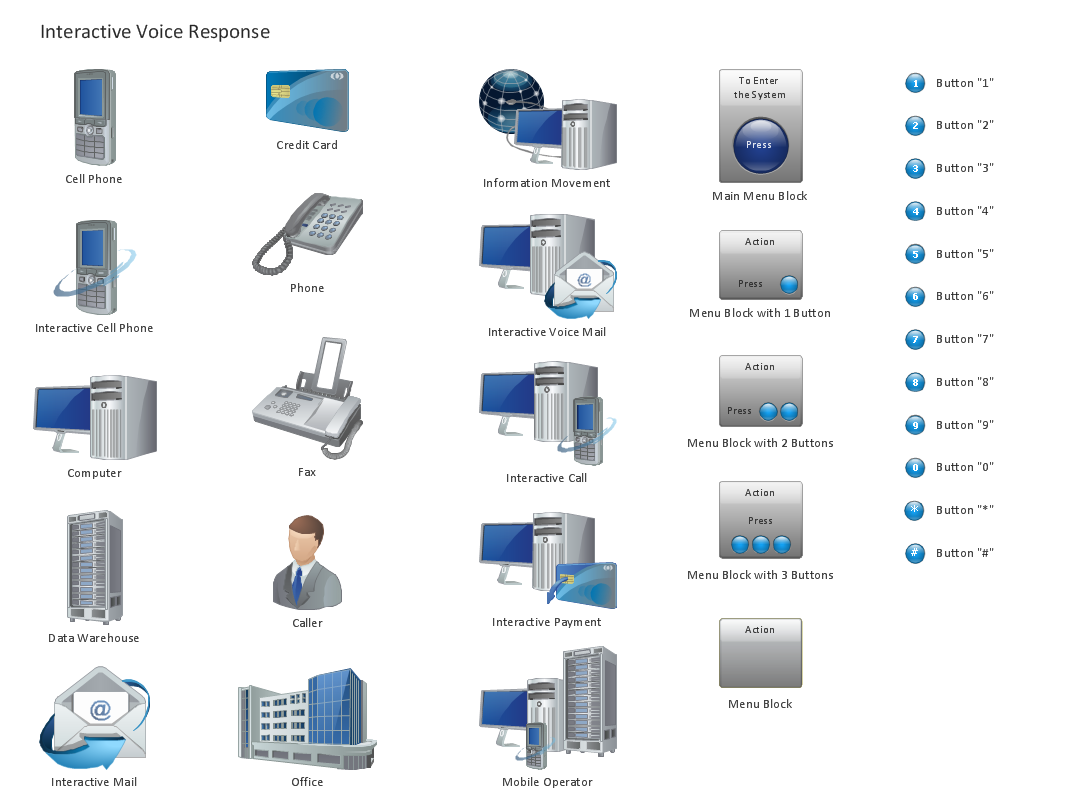
Design Element: IVR for Network Diagrams
ConceptDraw DIAGRAM is perfect for software designers and software developers who need to draw IVR Network Diagrams.
Data Flow Diagram Process
Data Flow Diagram (DFD) is a hierarchy of functional processes, connected by data flows. The purpose of this presentation is to show how each process converts its inputs into outputs and to identify relationships between these processes. DFD is convenient way of modeling and construction the information processes, it step-by-step illustrates the flow of information in a process. For construction a DFD traditionally are used two different notations, which appropriate to the methods of Yourdon-Coad and Gane-Sarson. These notations slightly different from each other by graphical representation of symbols for processes, data stores, data flow, external entities. When designing a DFD it is required to decompose the system into the components (sub-systems), for explaining a complex system you may need represent numerous levels. The Data Flow Diagrams solution from ConceptDraw Solution Park contains numerous predesigned DFD symbols for both notations, which help easy and effectively design professional-looking Data Flow Diagrams (DFDs) and DFD Process Diagrams.Network Diagramming Software for Design. Cisco Network Diagrams
Cisco is a famous corporation that develops, manufactures and sells worldwide a networking equipment. Cisco Network Diagrams are intended to document the topology, to visualize Cisco networks, to illustrate the arrangement and connections of network equipment, using the own brand Cisco network symbols, generally accepted as standard. The Cisco icons depict specific Cisco network equipment and connections lines, the style of which specifies the type of physical connection. These diagrams are globally recognized, are often created and used by network and system administrators, network designers, and other numerous IT professionals and corporate IT departments. ConceptDraw DIAGRAM software provides the set of powerful network diagrams software tools included to the Cisco Network Diagrams solution from Computer and Networks area of ConceptDraw Solution Park. This solution offers 15 libraries with 508 cisco vector elements that are ideal for professional and easy design Cisco Network Diagrams of any configuration, complexity and detailing.
 Telecommunication Network Diagrams
Telecommunication Network Diagrams solution extends ConceptDraw DIAGRAM software with samples, templates, and great collection of vector stencils to help the specialists in a field of networks and telecommunications, as well as other users to create Computer systems networking and Telecommunication network diagrams for various fields, to organize the work of call centers, to design the GPRS networks and GPS navigational systems, mobile, satellite and hybrid communication networks, to construct the mobile TV networks and wireless broadband networks.
Flowchart Marketing Process. Flowchart Examples
This sample shows the Flowchart that displays the layout and work flow of the cloud marketing platform. This diagram has a style of the marketing brochure. This style displays the central product that is related to the other issues. Using the ready-to-use predesigned objects, samples and templates from the Flowcharts Solution for ConceptDraw DIAGRAM you can create your own professional looking Flowchart Diagrams quick and easy.- Computer network system design diagram | Structured Systems ...
- Flow Chart The Simple Computer Network Systems
- Network Diagram System Analysis Design
- Networking Design For Bank Project Flow Diagram
- Communication network diagram | Network Diagramming with ...
- Diagrams Of Lan Wan Man Networks
- Computer network system design diagram | Draw Network Diagram ...
- Cisco LAN fault-tolerance system - diagram | Computer Network ...
- Computer network system design diagram | Computer network ...
- Network Design Process With Diagram


.png)


