Bar Diagrams for Problem Solving. Create manufacturing and economics bar charts with Bar Graphs Solution
Create bar charts for visualizing problem solving in manufacturing and economics using the ConceptDraw PRO diagramming and vector drawing software extended with the Bar Graphs Solution from the Graphs and Charts area of ConceptDraw Solition Park.Human Resources
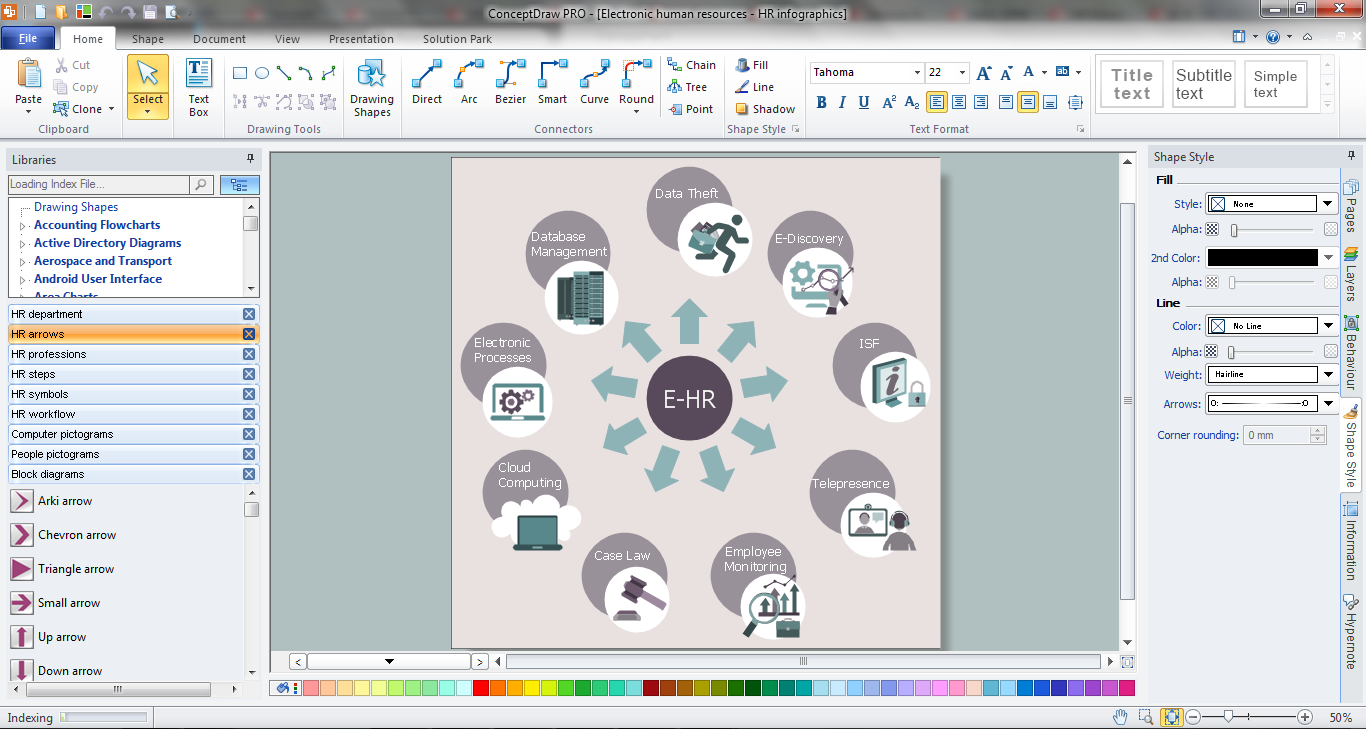
Human resources is the set of individuals who make up the workforce of an organization, business sector, or economy. ConceptDraw PRO diagramming and vector drawing software extended with unique HR Flowcharts Solution from the Management Area of ConceptDraw Solution Park is the best for designing various flowcharts and diagrams in the field of human resources management.This flow chart sample was drawn on the base on the illustration of the article "Climate change impact on China food security in 2050" from the website of Chinese Academy of Agricultural Sciences .
[caas.cn/ en/ newsroom/ research_ update/ 67347.shtml]
"Food security is a condition related to the ongoing availability of food. ...
According to the Food and Agriculture Organization (FAO), food security "exists when all people, at all times, have physical and economic access to sufficient, safe and nutritious food to meet their dietary needs and food preferences for an active and healthy life". ...
Extreme events, such as droughts and floods, are forecast to increase as climate change takes hold. Ranging from overnight floods to gradually worsening droughts, these will have a range of impacts on the agricultural sector. ...
According to the Climate & Development Knowledge Network report Managing Climate Extremes and Disasters in the Agriculture Sectors: Lessons from the IPCC SREX Report, the impacts will include changing productivity and livelihood patterns, economic losses, and impacts on infrastructure, markets and food security. Food security in future will be linked to our ability to adapt agricultural systems to extreme events." [Food security. Wikipedia]
The flowchart example "Food security assessment" was created using the ConceptDraw PRO diagramming and vector drawing software extended with the Flowcharts solution from the area "What is a Diagram" of ConceptDraw Solution Park.
Human Resource Development
Human Resource Development (HRD) focuses on the help employees develop their personal and organizational skills, abilities, and knowledge, HRD also helps to adapt an organization to the changing of external environment.ConceptDraw PRO diagramming and vector drawing software supplied with HR Flowcharts Solution from the Management Area of ConceptDraw Solution Park can effectively help in labour-intensive process of human resource development.
Human Resource Management
ConceptDraw PRO diagramming and vector drawing software enhanced with powerful HR Flowcharts Solution from the Management Area of ConceptDraw Solution Park perfectly suits for Human Resource Management.Donut Chart Templates
These donut chart templates was designed using ConceptDraw PRO diagramming and vector drawing software extended with Pie Charts solution from Graphs and Charts area of ConceptDraw Solution Park.All these donut chart templates are included in the Pie Charts solution.
You can quickly rework these examples into your own charts by simply changing displayed data, title and legend texts.
Bar Diagrams for Problem Solving. Create economics and financial bar charts with Bar Graphs Solution
Create bar graphs for visualizing economics problem solving and financial data comparison using the ConceptDraw PRO diagramming and vector drawing software extended with the Bar Graphs Solution from the Graphs and Charts area of ConceptDraw Solition Park.Economic Calendar
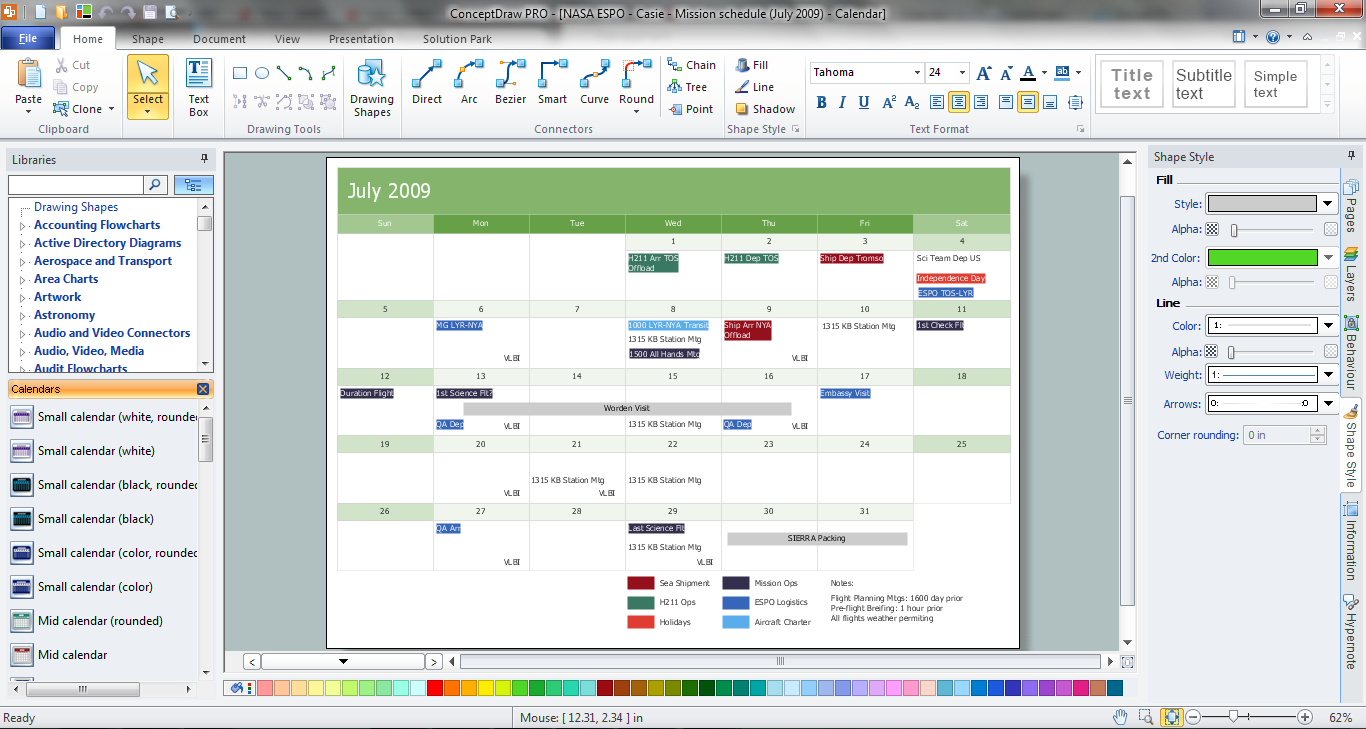
The economic calendar is a convenient way to display the economic events, the situation on the financial markets, it is a handy tool to keep track the chronology and dynamics of important events in the economy. But how design an economic calendar? ConceptDraw PRO extended with Calendars Solution from the Management Area is a useful, convenient and effective software for quick and easy design professional looking and attractive economic calendars.Venn Diagram Examples for Problem Solving. Environmental Social Science. Human Sustainability Confluence
The Venn diagram example below shows sustainable development at the confluence of three constituent parts.Create your Venn diagrams for problem solving in environmental social science using the ConceptDraw PRO diagramming and vector drawing software extended with the Venn Diagrams solution from the area "What is a Diagram" of ConceptDraw Solution Park.
Geo Map - USA - Montana
Montana is a state in the Western United States.The vector stencils library Montana contains contours for ConceptDraw PRO diagramming and vector drawing software. This library is contained in the Continent Maps solution from Maps area of ConceptDraw Solution Park.
Geo Map - Europe - Belarus
The vector stencils library Belarus contains contours for ConceptDraw PRO diagramming and vector drawing software. This library is contained in the Continent Maps solution from Maps area of ConceptDraw Solution Park.
 Pie Charts
Pie Charts are extensively used in statistics and business for explaining data and work results, in mass media for comparison (i.e. to visualize the percentage for the parts of one total), and in many other fields. The Pie Charts solution for ConceptDraw PRO v10 offers powerful drawing tools, varied templates, samples, and a library of vector stencils for simple construction and design of Pie Charts, Donut Chart, and Pie Graph Worksheets.
 Target and Circular Diagrams
This solution extends ConceptDraw PRO software with samples, templates and library of design elements for drawing the Target and Circular Diagrams.
This step chart sample was created on the base of the webpage from the website Invest Punjab (Invest Punjab,
Punjab Bureau of Investment Promotion).
"Opportunities in Agro and Food Processing sector in Punjab:
(1) “Food Bowl of India” - Leading food producer of India with intensive cultivation of 2-3 crops per year.
(2) Highly mechanized agricultural practices with irrigation network available to 98% of the cultivable land.
(3) Robust infrastructure and a well developed ecosystem." [progressivepunjab.gov.in/ opportunitiesdetails.aspx?id=7]
The step chart example "Opportunities in agro and food processing sector in Punjab" was created using the ConceptDraw PRO diagramming and vector drawing software extended with the Marketing Diagrams solution from the Marketing area of ConceptDraw Solution Park.
- Designer Flow Charts On Sectors Of Economy
- Flow Chart And Piechart In Software Development Economic Sector
- Draw A Flow Chart Of Sectors Of Production
- Process Flowchart | Pie Chart Examples and Templates | Flowchart ...
- Process Flowchart | Bar Diagrams for Problem Solving. Create ...
- Sector weightings - Exploded pie chart | Bar Diagrams for Problem ...
- Flowchart Of Business Sectors
- Flow Chart Of Any Business With Sectors
- Flow Chart Business Sectors
- A Flowcharts Of Business Sectors
- Flow Chart Of Business Sectors
- Process Flowchart | Seating Plans | Sector weightings - Exploded ...
- Pie Chart Examples and Templates | Process Flowchart | Business ...
- Sector weightings - Exploded pie chart | Process Flowchart | Pie ...
- Process Flowchart | Pie Chart Examples and Templates | Lean Six ...
- HR Flowcharts | How to Create a HR Process Flowchart Using ...
- Manufacturing Chart
- Basic Flowchart Symbols and Meaning | HR Flowchart Symbols ...
- Flowchart Of Human Resource Planning
- Sector diagram - Template | Sector weightings - Exploded pie chart ...

