Pyramid Chart Examples
Pyramid Charts and Triangle Diagrams are used to visually structure the topics and progressively order the quantitative data. They allow to illustrate hierarchical structure of the topics, proportional, interconnected and containment relations among the topics. The multilevel Pyramids and Triangle diagrams are constructed oriented up or down and divided into several horizontal slices. They are effectively used to represent marketing strategies, social strategies, information systems, market value, etc., to illustrate presentations, websites, documents, reports in business, finances, sales, management, marketing, media, training, consulting, and many other fields. To maximize the efficiency in drawing the Pyramid Charts, use the ConceptDraw PRO diagramming and vector drawing software extended with Pyramid Diagrams solution from Marketing area, which contains the set of Pyramid Chart examples, samples, templates and vector design elements of triangular diagrams and pyramids with different quantity of levels for various needs.Flowchart on Bank. Flowchart Examples
This sample was created in ConceptDraw PRO diagramming and vector drawing software using the Flowcharts solution from the Diagrams area of ConceptDraw Solution Park. This sample shows the Flowchart of the Subprime Mortgage Crisis. This Flowchart describes the decline in housing prices when the housing bubble burst and what it caused on the housing and financial markets. You can also see the Government and Industry responses in this crisis situation.
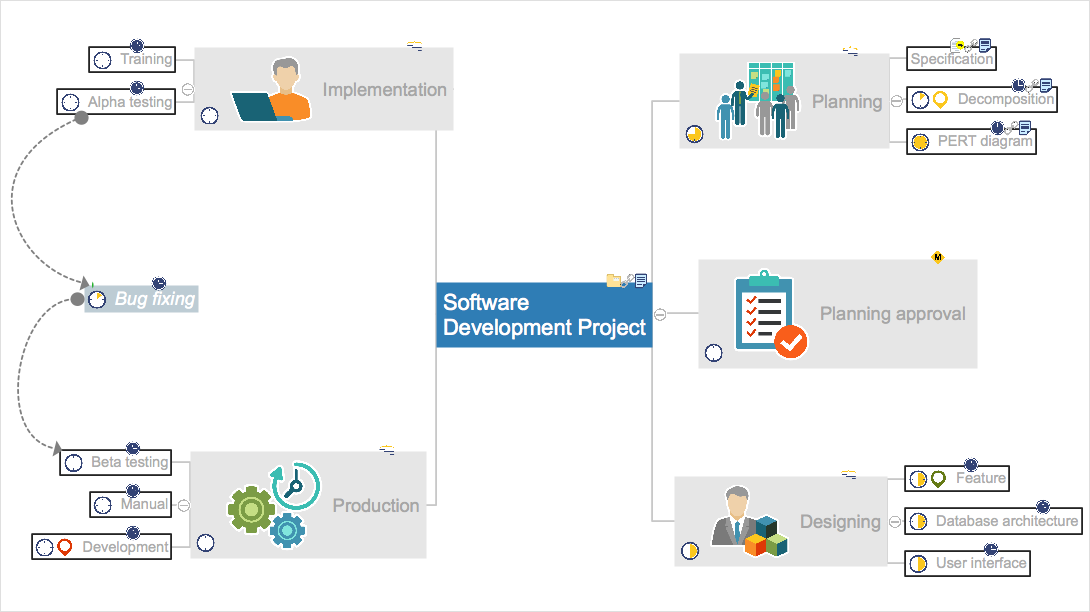
Project —Task Trees and Dependencies
Users new to ConceptDraw PROJECT will find the Basic lessons an essential platform for familiarizing themselves with the program′s functions. This video lesson will teach you how to set up task trees and dependencies.Bank Customer Positive Feedback
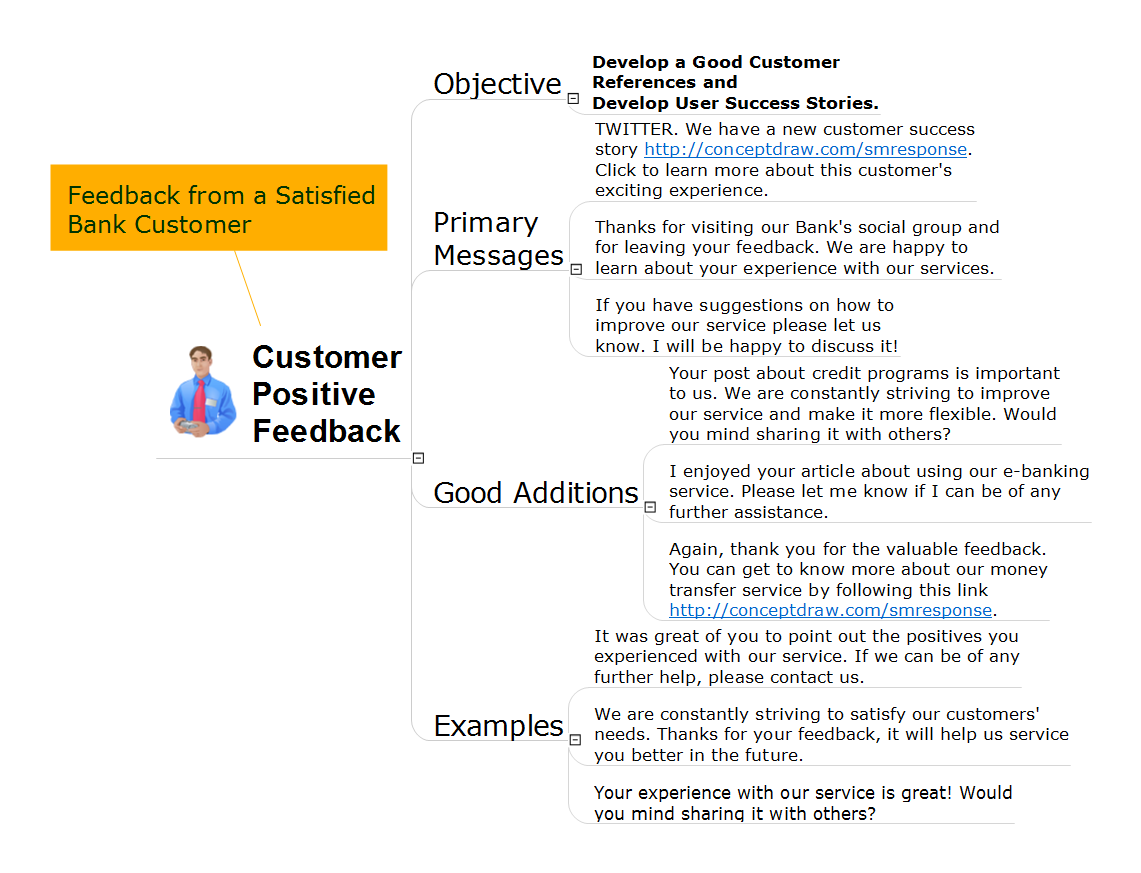
Reviews are the mega-effective sales tool, but as our emotions are multifarious, the customers' reviews and opinions can be also different - positive and negative. It is important to know this fact to correctly react and answer to both. Reviews and feedbacks are ones of the important components of successful development of any business, in finance, banking and other spheres. It is very important to treat seriously to the question of feedbacks, because in modern world when the client thinks about the purchase of any product, in most cases he looks for feedbacks, studies them, herewith reaction and answers of the company's representatives are also always within sight. Reviews allow to learn more about the product and about the company as a whole, to explore the pros and cons of this product or service, to figure out whether you can trust this company and how well it relates to customers after purchase - at the stage of questions, warranty, repair, etc. This action Mind Map created in ConceptDraw MINDMAP depicts how to answer correctly on the customer's positive feedbacks and helps to develop the user success stories and to receive a lot of good customer references.Types of Flowcharts
A Flowchart is a graphical representation of process, algorithm, workflow or step-by-step solution of the problem. It shows the steps as boxes of various kinds and connects them by arrows in a defined order depicting a flow. There are twelve main Flowchart types: Basic Flowchart, Business Process Modeling Diagram (BPMN), Cross Functional Flowchart, Data Flow Diagram (DFD), IDEF (Integrated DEFinition) Flowchart, Event-driven Process Chain (EPC) Diagram, Influence Diagram (ID), Swimlane Flowchart, Process Flow Diagram (PFD), Specification and Description Language (SDL) Diagram, Value Stream Mapping, Workflow Diagram. Using the Flowcharts solution from the Diagrams area of ConceptDraw Solution Park you can easy and quickly design a Flowchart of any of these types. This solution offers a lot of special predesigned vector symbols for each of these widely used notations. They will make the drawing process of Flowcharts much easier than ever. Pay also attention for the included collection of ready Flowchart examples, samples and quick-start templates. This is business process improvement tools. If you are looking for MS Visio for your Mac, then you are out of luck, because it hasn't been released yet. However, you can use Visio alternatives that can successfully replace its functions. ConceptDraw PRO is an alternative to MS Visio for Mac that provides powerful features and intuitive user interface for the same.
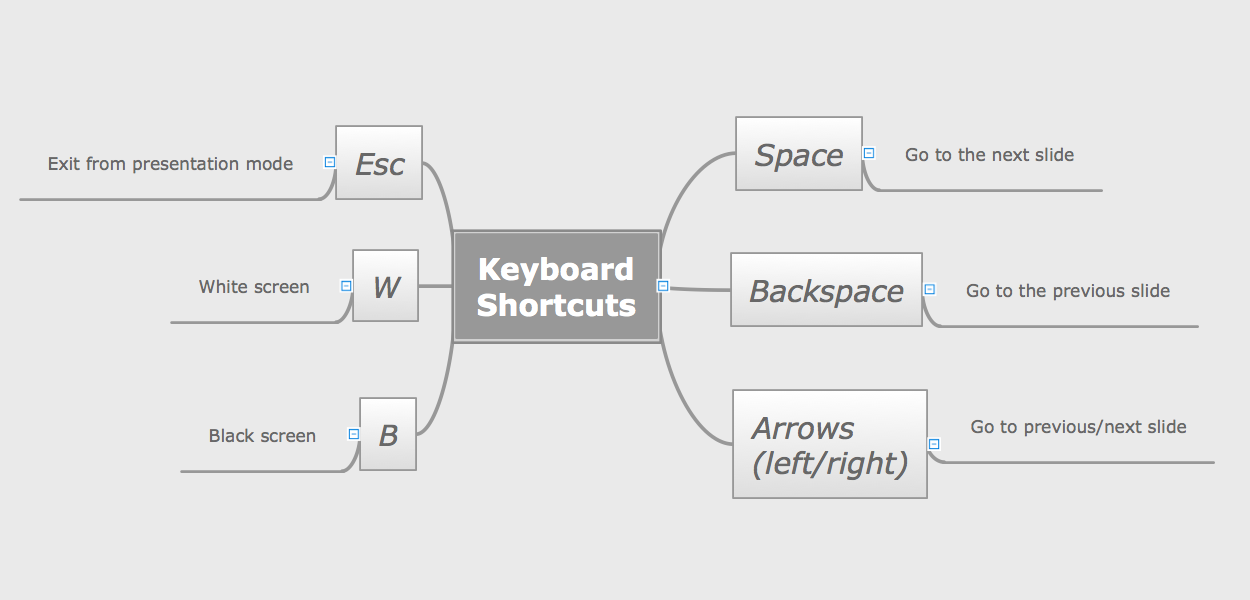
How To Use Collaboration Software
Collaboration Software helps to transform shared MINDMAP documents to build an effective team collaboration.
HelpDesk
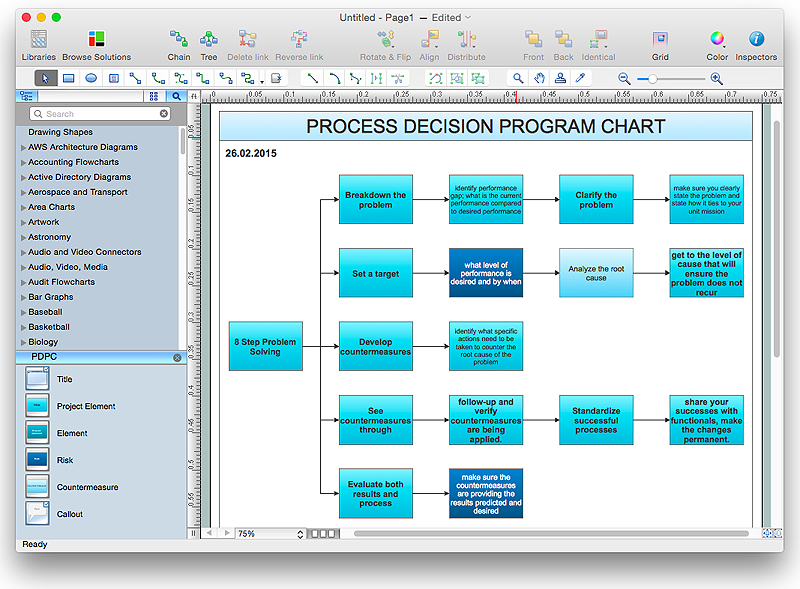
How To Create Risk Diagram (PDPC)
Article on how to identify possible risks when carrying out corrective actions, and define preventive actions
HelpDesk
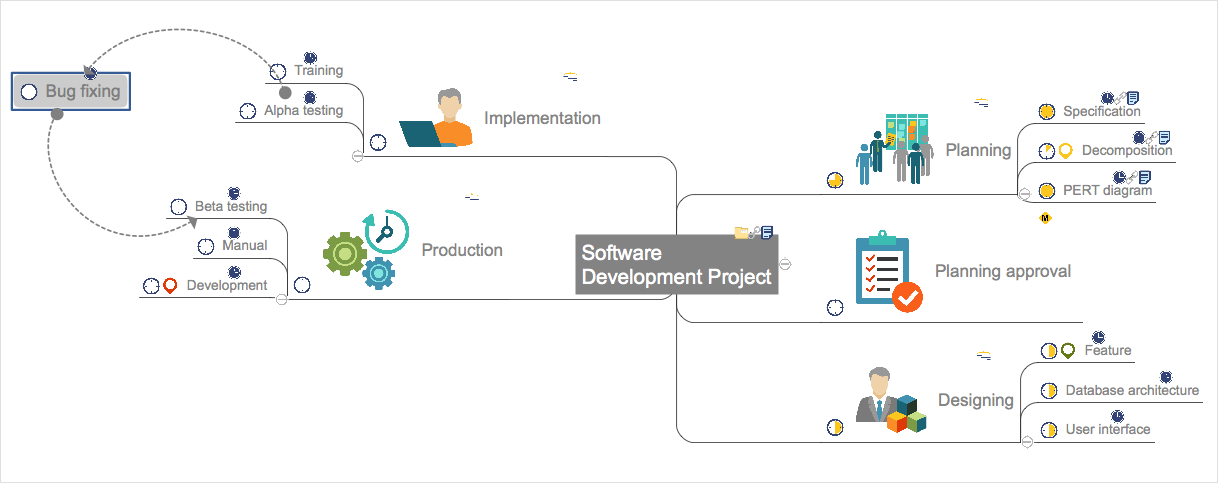
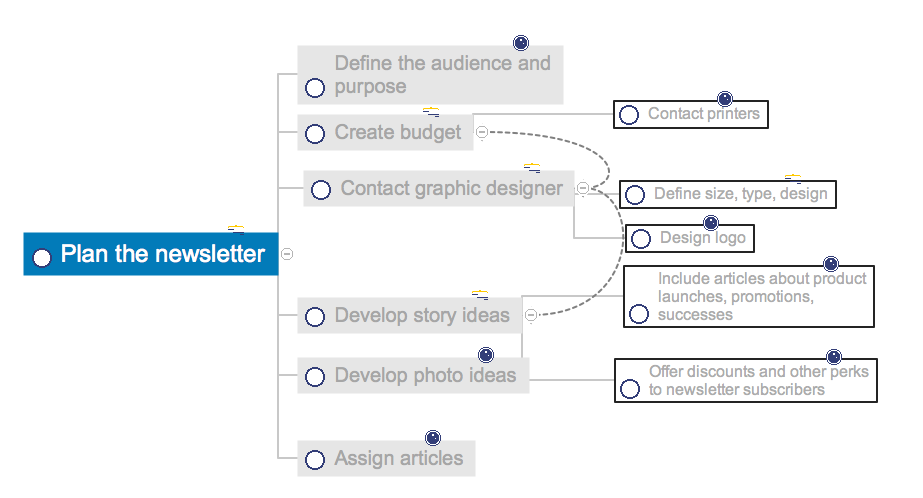
How to Create an Effective Mind Map Using Topic Types
Tips on how to increase mind map effectiveness using Topic Types functionality, delivered with ConceptDraw MINDMAP.HelpDesk
How to Create Floating Topics in a Mind Map
With ConceptDraw MINDMAP you have the ability to create floating topics that are not connected to the mind map structure. Since a floating topic is not connected to any other topics on the mind map, you can use it for future development of your main idea. This is a good way to make comments that relate to the entire map and not a separate topic.HelpDesk
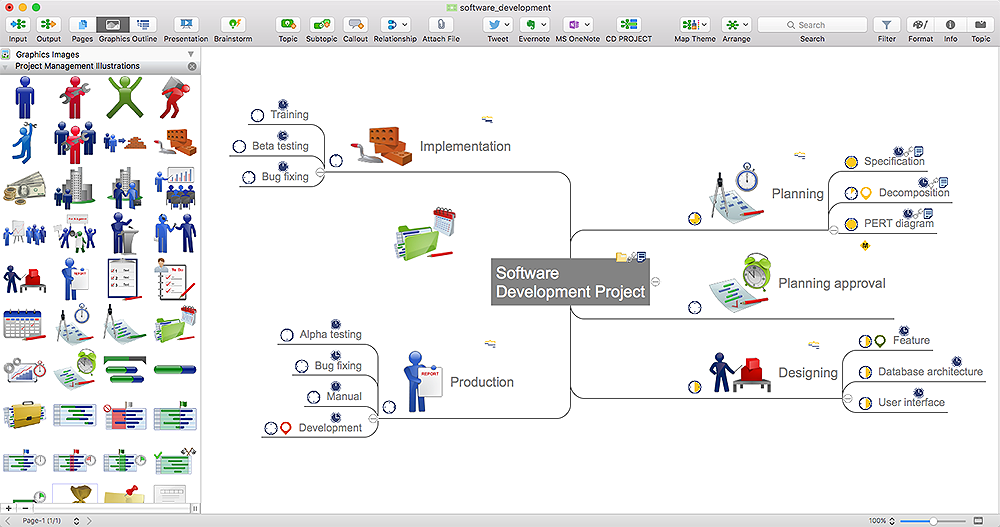
How to Connect an Image to a Topic in Your Mind Map
ConceptDraw MINDMAP gives a possibility to connect image to topic making your mind map more memorable and brain friendly. You can add images to any element of a map.HelpDesk
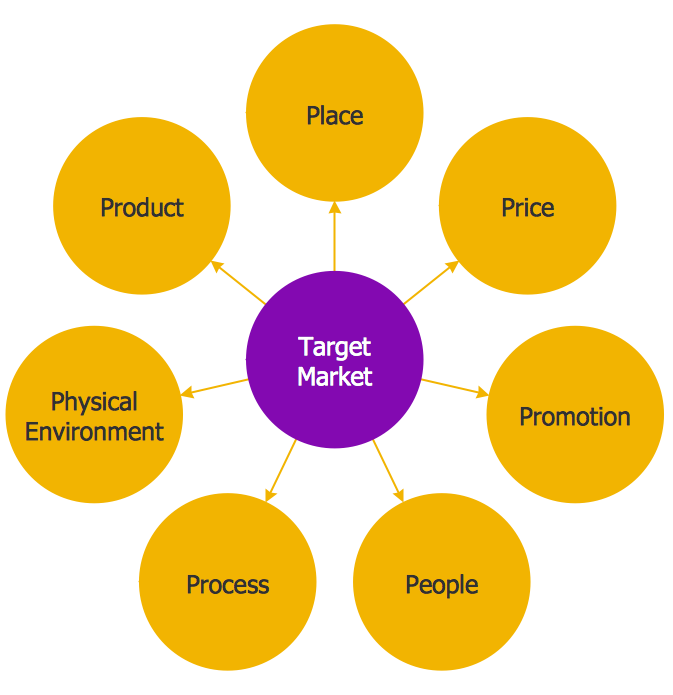
How to Draw a Circle-Spoke Diagram Using ConceptDraw PRO
Making circle-spoke diagram is a very useful technique if you want to explore cause and effect. A Circle-Spoke Diagram is a tool that is often used in marketing sphere. Circle-spoke diagram consists from a central circle surrounded in a round arrangement by related sub-circles. They are used to depict the features or components of a central item in a number of areas. Circle-spoke diagram are widely used in marketing and management documents as well as presentations. A Circle-Spoke Diagram is a very useful tool if you want to perform the Cause and Effect analysis. ConceptDraw PRO delivers the ability to make circle-spoke diagrams of various styles with its Circle-Spoke Diagrams solution.HelpDesk
How To Create Root Cause Analysis Diagram Using ConceptDraw Office
Root Cause Analysis (RCA) is used to determine the main causes of the problem. If the certain factor is the root cause, this mean that its vanishing will help to prevent the further recurrence of the problem. Root Cause Analysis diagram is used to analyze the root causes of factors that influence the problem. It helps to identify the root causes for a factor and then propose possible corrective actions. A diagram is constructed separately for each high priority factor. The ability to create a RCA tree diagram from a mind map is supported by the ConceptDraw Seven Management and Planning Tools solution.HelpDesk
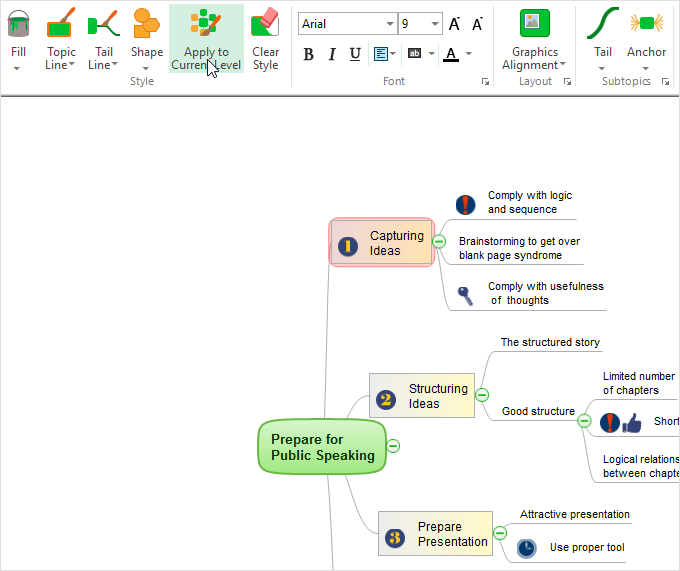
How to Format Topics
ConceptDraw MINDMAP enables you to change the form and color of a mind map topics. Here is the tips on how to edit mind map appearance quickly by changing topic's form and color.HelpDesk
How to Change the Form and Color of a Topic’s Line in Your Mind Map
You can completely customize the style of your mind maps, including the style of topic lines and outlines. This article describes how to change the form and color of a topic’s line in your mind map.HelpDesk
How to Create a Bubble Diagram Using ConceptDraw PRO
Bubble Diagram is a simple chart that consists of circles (bubbles) repesening certain topics or processes. Bubbles are connected by lines depicting the type of relationships between the bubbles. The size of each bubble is depended on the importance of the entity it represents. Bubble charts are widely used throughout social, economical, medical, and other scientific researches as well as throughout architecture and business management. Bubble charts are often used during the early stages of product development to visualize thoughts and ideas for the purpose of sketching out a development plan. ConceptDraw PRO allows you to draw a bubble diagrams using the Bubble Diagrams solution.- Flowchart Example: Flow Chart of Marketing Analysis | How to ...
- Flowcharts On Maths Topics
- Process Flowchart | Flowchart Marketing Process. Flowchart ...
- How to Connect Social Media DFD Flowchart with Action Maps ...
- How to Create a Social Media DFD Flowchart | Ice Hockey Diagram ...
- How to Connect Social Media DFD Flowchart with Action Maps ...
- Process Flowchart | Social Ecological Model (SEM) - Onion diagram ...
- Work Order Process Flowchart . Business Process Mapping ...
- Social Media Flowchart Symbols | How to Create a Pyramid ...
- Mind Map Social Networking Positives And Negatives
- Pyramid Chart Examples | Work Order Process Flowchart . Business ...
- Pyramid Chart Examples | Pie Chart Word Template. Pie Chart ...
- Flowchart Marketing Process. Flowchart Examples | Flowchart ...
- Social media activity of a real estate agent | Work Order Process ...
- Work Order Process Flowchart . Business Process Mapping ...
- Business Diagram Software | Work Order Process Flowchart ...
- Pyramid Chart Examples | Social Media Response | UML interaction ...
- A Easy Topic Of SST With Diagram
- Copying Service Process Flowchart . Flowchart Examples | Pyramid ...
- Work Order Process Flowchart . Business Process Mapping ...


