 Audit Flowcharts
Audit flowcharts solution extends ConceptDraw PRO software with templates, samples and library of vector stencils for drawing the audit and fiscal flow charts.
HelpDesk
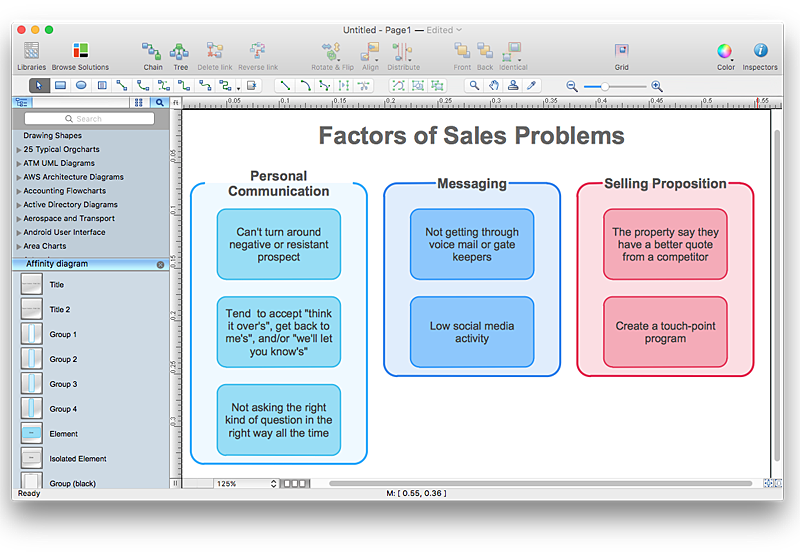
How To Create an Affinity Diagram Using ConceptDraw Office
Affinity diagram is designed to prepare the data for further analysis of the cause-effect relationships.The Affinity diagram shows the structure of large, complex factors that have an influence on a problem, and then divides them up into a smaller and simpler structure. We recommend using a mind map for Brainstorming and collecting the factors affecting the problem. The ability to create an Affinity diagram from a mind map is supported by the ConceptDraw Seven Management and Planning Tools solution.
 Flowcharts
The Flowcharts Solution for ConceptDraw PRO v10 is a comprehensive set of examples and samples in several different color themes for professionals that need to graphically represent a process. Solution value is added by basic flow chart template and shapes' library of Flowchart notation. ConceptDraw PRO flow chart creator lets one depict a processes of any complexity and length, as well design of the flowchart either vertically or horizontally.
HelpDesk
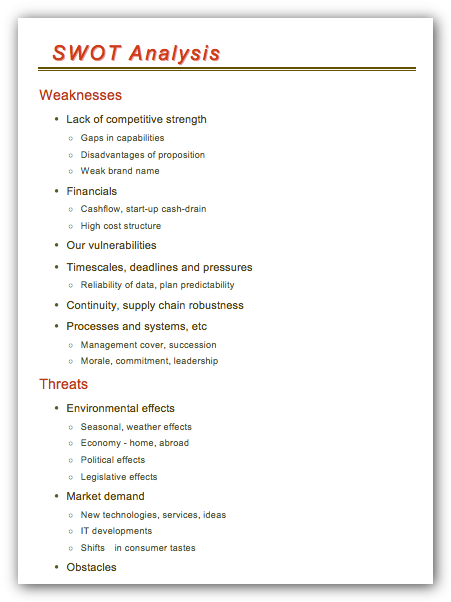
How to Make SWOT Analysis in a Word Document
A SWOT analysis is a strategic planning tool that helps to identify and compare strengths and weaknesses with opportunities and threats to make a decision and create an action plan. When performing a SWOT analysis, one can create a table split up into four columns so as to list each impacting element side-by-side for comparison, but typically it is conducted using a four-square SWOT analysis template. Using mind map allows you to collect and structure an information involved in SWOT Analysis then, you can export your SWOT mind map into a MS Word document that allows you to present and collaborate your business strategic SWOT analysis matrix in MS Word document.
 Accounting Flowcharts
Accounting Flowcharts solution extends ConceptDraw PRO software with templates, samples and library of vector stencils for drawing the accounting flow charts.
HelpDesk
How To Create Root Cause Analysis Diagram Using ConceptDraw Office
Root Cause Analysis diagram is used to analyze the root causes of factors that influence the problem. If the certain factor is the root cause, this mean that its vanishing will help to prevent the further recurrence of the problem. Root Cause diagram helps to identify the root causes for a factor and then propose possible corrective actions. A diagram is constructed separately for each high priority factor. The ability to create a RCA tree diagram from a mind map is supported by the ConceptDraw Seven Management and Planning Tools solution.HelpDesk
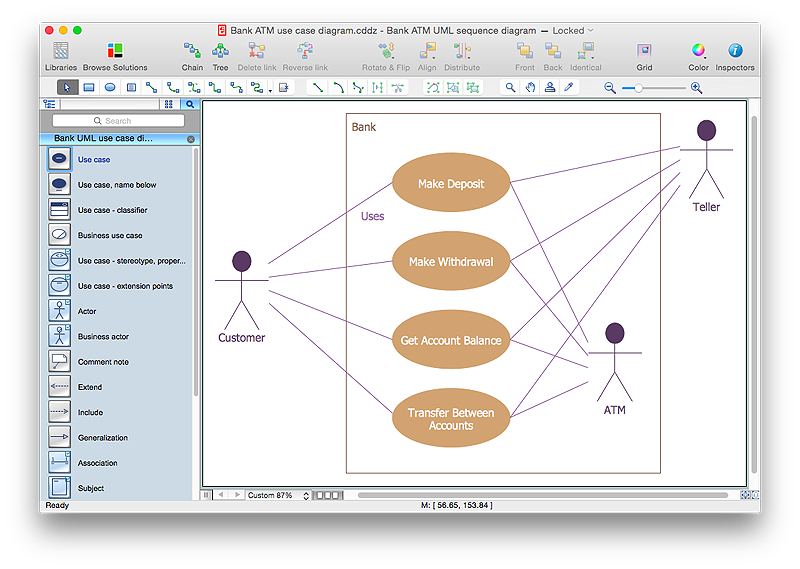
How to Create a Bank ATM Use Case Diagram Using ConceptDraw PRO
UML diagrams are often used in banking management for documenting a banking system. In particular, the interaction of bank customers with an automated teller machine (ATM) can be represented in a Use Case diagram. Before the software code for an ATM, or any other system design, is written, it is necessary to create a visual representation of any object-oriented processes. This is done most effectively by creating a Unified Modeling Language (UML) diagram, using object-oriented modeling. UML works as a general purpose modeling language for software engineers or system analysts, offering a number of different diagram styles with which to visually depict all aspects of a software system.ConceptDraw PRO diagramming software, enhanced and expanded with the ATM UML Diagrams solution, offers the full range of icons, templates and design elements needed to faithfully represent ATM and banking information system architecture using UML standards. The ATM UML Diagrams solution is useful for beginner and advanced users alike. More experienced users will appreciate a full range of vector stencil libraries and ConceptDraw PRO's powerful software, that allows you to create your ATM UML diagram in a matter of moments.
 Event-driven Process Chain Diagrams
Event-driven Process Chain (EPC) Diagram is a type of flowchart widely used for modeling in business engineering and reengineering, business process improvement, and analysis. EPC method was developed within the Architecture of Integrated Information Systems (ARIS) framework.
 Interactive Voice Response Diagrams
Interactive Voice Response Diagrams solution extends ConceptDraw PRO v10 with samples, templates and library of ready-to-use vector stencils to help create Interactive Voice Response (IVR) diagrams illustrating a work of interactive voice response system, Voice-over-Internet Protocol (VoIP) diagrams and Action VoIP diagrams with representing voice actors on them.
 Enterprise Architecture Diagrams
Enterprise Architecture Diagrams solution extends ConceptDraw PRO software with templates, samples and library of vector stencils for drawing the diagrams of enterprise architecture models.
 Management Area
The solutions from Management area of ConceptDraw Solution Park collect templates, samples and libraries of vector stencils for drawing the management diagrams and mind maps.
HelpDesk
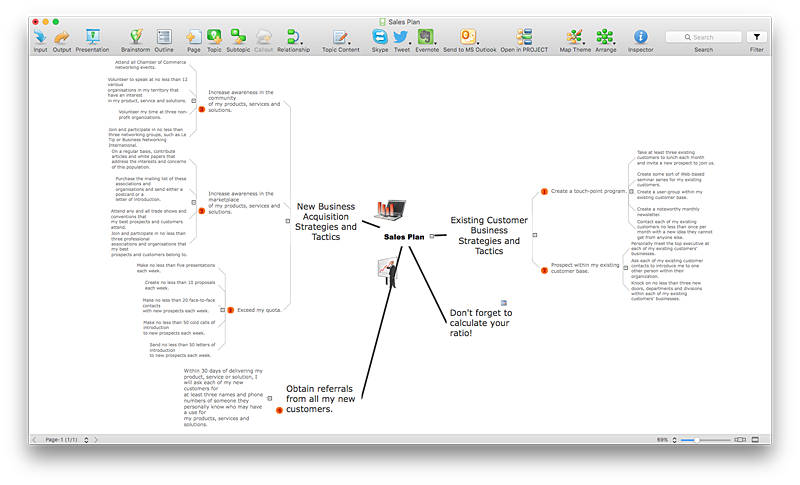
How to Change the Font for an Entire Level of a Mind Map
The visual representation of information is much more productive than simple linear transfer because it is more natural for our brain to understand information in the form of visual images. ConceptDraw MINDMAP will help you put your thoughts and ideas across to any audience in the most intelligible and memorable way. Mind maps can be used in a great number of situations involving analysis, learning, research and thinking. Use them for personal planning, preparing lists, working on projects, as well as analyzing problems and finding solutions. ConceptDraw MINDMAP provides a variety of style and formatting options for your mind maps, that let you add more information to your mind map without interfering with its readability.
 Business Process Diagrams
The Business Process Diagram Solution extends ConceptDraw PRO v10 BPMN software with its RapidDraw interface, templates, samples, and libraries based on the BPMN 1.2 and BPMN 2.0 standards. This powerful solution permits you to visualize easily both simple and complex processes, as well as design business models. The Business Process Diagram solution allows one to quickly develop and document in detail any business processes at any stage of a project’s planning and implementation.
 Business Productivity Area
Business Productivity Solutions extend ConceptDraw products with tools for making presentations, conducting meetings, preparing documents, brainstorming, or building new strategies.
- Process Flowchart | Business Diagram Software | Spatial Data ...
- Process Flowchart | Structured Systems Analysis and Design ...
- Process Flowchart | Event-driven Process Chain Diagrams | Types ...
- Spatial infographics Design Elements: Location Map | Process ...
- How to Create Presentation of Your Project Gantt Chart | Data Flow ...
- SWOT and TOWS Matrix Diagrams | SWOT Analysis | Marketing ...
- Process Flowchart | Types of Flowchart - Overview | Material ...
- What Constitutes a Project? | What Is a Picture Graph? | What can ...
- Fishbone Diagram | Fishbone Diagrams | ConceptDraw Solution ...
- SWOT Analysis Solution - Strategy Tools | How to Connect an Image ...
- How to Draw Geometric Shapes in ConceptDraw PRO ...
- SWOT Analysis Tool for Small Business | SWOT Analysis | How to ...
- Export from ConceptDraw PRO Document to PPT or PPTX (MS ...
- Sales Process Map | Vector Map of Germany | How to Convert a ...
- Copying Service Process Flowchart . Flowchart Examples | Flowchart ...
- Marketing | Seven Management and Planning Tools | Entity ...
- Business Process Modeling Notation Template | Workflow Diagram ...
- Process Flowchart | Cross-Functional Flowchart (Swim Lanes ...
- Design elements - Chemical drawings | Chemistry Equation ...
- Pie Charts | Life cycle analysis - Ring chart | Bar Diagram Math | Pie ...


