Flow chart Example. Warehouse Flowchart
Warehouse Flowcharts are various diagrams that describe the warehousing and inventory management processes on the warehouses. Typical purposes of Warehouse Flowcharts are evaluating warehouse performance, measuring efficiency of customer service and organizational performance. This type of Workflow diagrams can be used for identifying any disconnection between business activities and business objectives. They are effectively used by warehouse-related people and organizations, manufacturers, wholesalers, exporters, importers, transporters, and others. Standard Warehousing process flow diagram and standard Workflow diagram are used for process identification for further evaluating effectiveness and profitability of overall business process. Use the ConceptDraw PRO vector graphic software extended with Flowcharts solution to design your own professional-looking Workflow diagrams and Flowcharts of any types, including the Warehouse flowchart, Process flow diagrams which depict in details all steps of Warehouse packages flow. Microsoft Visio, designed for Windows users, can’t be opened directly on Mac. But fortunately, there are several Visio alternatives for Mac which will help Mac users to work Visio files. With ConceptDraw PRO, you may open, edit and save files in Visio format.
Bar Diagrams for Problem Solving. Create economics and financial bar charts with Bar Graphs Solution
Create bar graphs for visualizing economics problem solving and financial data comparison using the ConceptDraw PRO diagramming and vector drawing software extended with the Bar Graphs Solution from the Graphs and Charts area of ConceptDraw Solition Park.Workflow Flowchart Symbols
The Workflow diagrams are the specialized type of flowcharts which allow to visualize any sorts of step-by-step processes. They are usually created as flowcharts, with objects that represent in a simple visual manner the steps in the process connected by arrows that indicate the next step. The ability easily create Workflow diagrams visually describing the tasks, documents associated with the tasks, people which are responsible for execution at each stage of workflow is made possible with Workflow Diagrams solution. This solution extends ConceptDraw PRO with a Workflow Diagram library that contains large collection of predesigned workflow flowchart symbols.Lean Six Sigma Diagram Software
Lean Six Sigma (LSS) is a well-known in all over the world methodology of quality improvement and business perfection. ConceptDraw PRO diagramming and vector drawing software is a powerful Lean Six Sigma Diagram Software thanks to the included Value Stream Mapping solution from the Quality Management Area of ConceptDraw Solution Park.How to Draw Pictorial Chart. How to Use Infograms
How to draw pictorial chart quick, easy and effective? ConceptDraw PRO offers the unique Pictorial Infographics Solution that will help you! Pictorial Infographics solution contains large number of libraries with variety of predesigned vector pictograms that allows you design infographics in minutes. There are available 10 libraries with 197 vector pictograms.How to Create a Line Chart
Create a Line Chart with ConceptDraw using our tips. Here you can find an explanation of how to create a line chart quickly.Fully Connected Network Topology Diagram
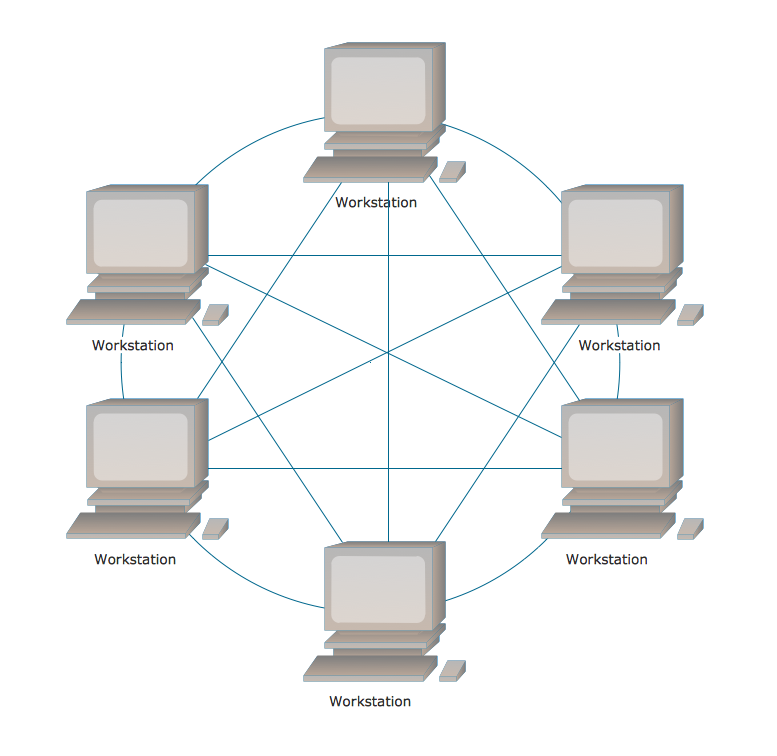
Fully Connected Network Topology (Complete topology, Full mesh topology) is a network topology characterized by existence of direct links between all pairs of nodes. The Fully connected network including n nodes, contains n(n-1)/2 direct links. This topology is mostly used in military applications. It is a quite expensive network technology and is extremely impractical for the large networks. But when it is set, it provides a high degree of reliability thanks to the large quantity of redundant links between nodes and so multiplicity of paths for the data. The two-node network is also considered as a Fully connected network. Computer Network Diagrams solution from Computer and Networks area of ConceptDraw Solution Park offers the predesigned vector stencils libraries, examples and templates for easy designing various Computer network topology diagrams for wired and wireless networks, including the Fully connected topology. This solution is intended to help computer network designers and engineers perfectly illustrate network documentation, reports, presentations, etc.Sample Pictorial Chart. Sample Infographics
Sample Pictorial Chart - Pictorial Infographics solution provides easy-to-use design infographics drawing tools, large collection of different sample infographics and infograms, sample pictorial chart and templates to be filled in, and 10 libraries with great quantity of predesigned vector pictograms. Use Pictorial Infographics solution to draw your own design pictorial infographics documents quick and easy.Geo Map — South America — Peru
Peru, officially the Republic of Peru, is a country in western South America. The history of Peru goes back to the distant past and its divided into several main stages. Geography of Peru is also diverse - there is a desert, as well as the ocean coast, and of course the mountain ranges. The Continent Maps solution from Maps area of ConceptDraw Solution Park provides stencil library Peru, which is made up of well-designed vector shapes delivering easy experience in creating diagrams with ConceptDraw Pro software. All ConceptDraw PRO documents are vector graphic files and are available for reviewing, modifying, and converting to a variety of formats: image, HTML, PDF file, MS PowerPoint Presentation, Adobe Flash, MS Visio (.VDX, .VSDX).- Agriculture Practices Flow Chart
- Flow Chart On Different Agriculture Practices
- Make A Flowchart Showing The Different Agricultural Practices In ...
- Make A Flow Chart Showing The Different Agriculture Practices In ...
- Draw The Diagram Of Agricultural Practice Step By Step
- Chart Of Agricultural Practice
- Flow Chart Showing Agricultural Practices In Sequential Order
- Area Charts | Flowchart Showing Types Of Agriculture
- Flow Chart On Agriculture
- Agriculture Steps Flowchart


