How to Create Flowcharts for an Accounting Information System
Accounting information is a system of interrelated processes which represent financial and accounting data, required for decision making. For representing the accounting processes in a visual and easy for perception form are constructed Accounting Flowcharts. For their creation are used special flowchart symbols, this makes Accounting flowcharts understandable for all users of accounting information system and helps them easy understand the sequence of steps involved to accounting processes. But how to create Flowcharts for an Accounting Information System fast and easy? Use of special design software is useful for this. ConceptDraw DIAGRAM software extended with Accounting Flowcharts solution is the best for creation accurate Accounting Flowcharts, for documentation and visually communication on how accounting processes work, how each operation is done. Accounting Flowcharts solution is supplied with library of predesigned commonly used vector symbols, Accounting Flowchart templates and samples demonstrating receiving, purchasing, payment, and other accounting processes.Basic Flowchart Images. Flowchart Examples
This sample was created in ConceptDraw DIAGRAM diagramming and vector drawing software using the Flowcharts solution from the Diagrams area of ConceptDraw Solution Park. This sample shows the Flowchart that displays the procedures of 2PP (two-party preferred) voting and counting the voters. The two-party-preferred vote is the result of the elections that was distributed to the final two parties.Swim Lane Diagrams
Swim Lane Diagrams are the kind of process flow diagrams and effective tool for documenting the business processes required for any business company for its productive work, for easy defining the weak points, reasons of defects, or delays during the process. Swim Lane Diagram is based on the IDEF3 standard and was developed primarily for using in projecting. Its name derives from the use of horizontal or vertical lanes. The blocks that denote the parts of the processes are arranged within definite lanes according to the belonging to responsible worker. So the process of any complexity is visually divided into the parts and represented with indication the responsibility for execution of each part. This significantly facilitates the comprehension of its work. Use the ConceptDraw DIAGRAM software and predesigned vector objects from the Swim Lanes library of Business Process Mapping Solution included to ConceptDraw Solution Park to easy develop Swim Lanes Flowcharts and Diagrams, for modeling and documenting the business processes in a simple and visual graphic form.Best Value Stream Mapping mac Software
Create value stream maps - for value stream analysis and value stream management, material and information flow mapping, using our quick start templates included with ConceptDraw.Chemical Engineering
ConceptDraw DIAGRAM is a powerful diagramming and vector drawing software. Extended with Chemical and Process Engineering Solution from the Industrial Engineering Area of ConceptDraw Solution Park, it became the best Chemical Engineering software.GUI Prototyping with ConceptDraw DIAGRAM
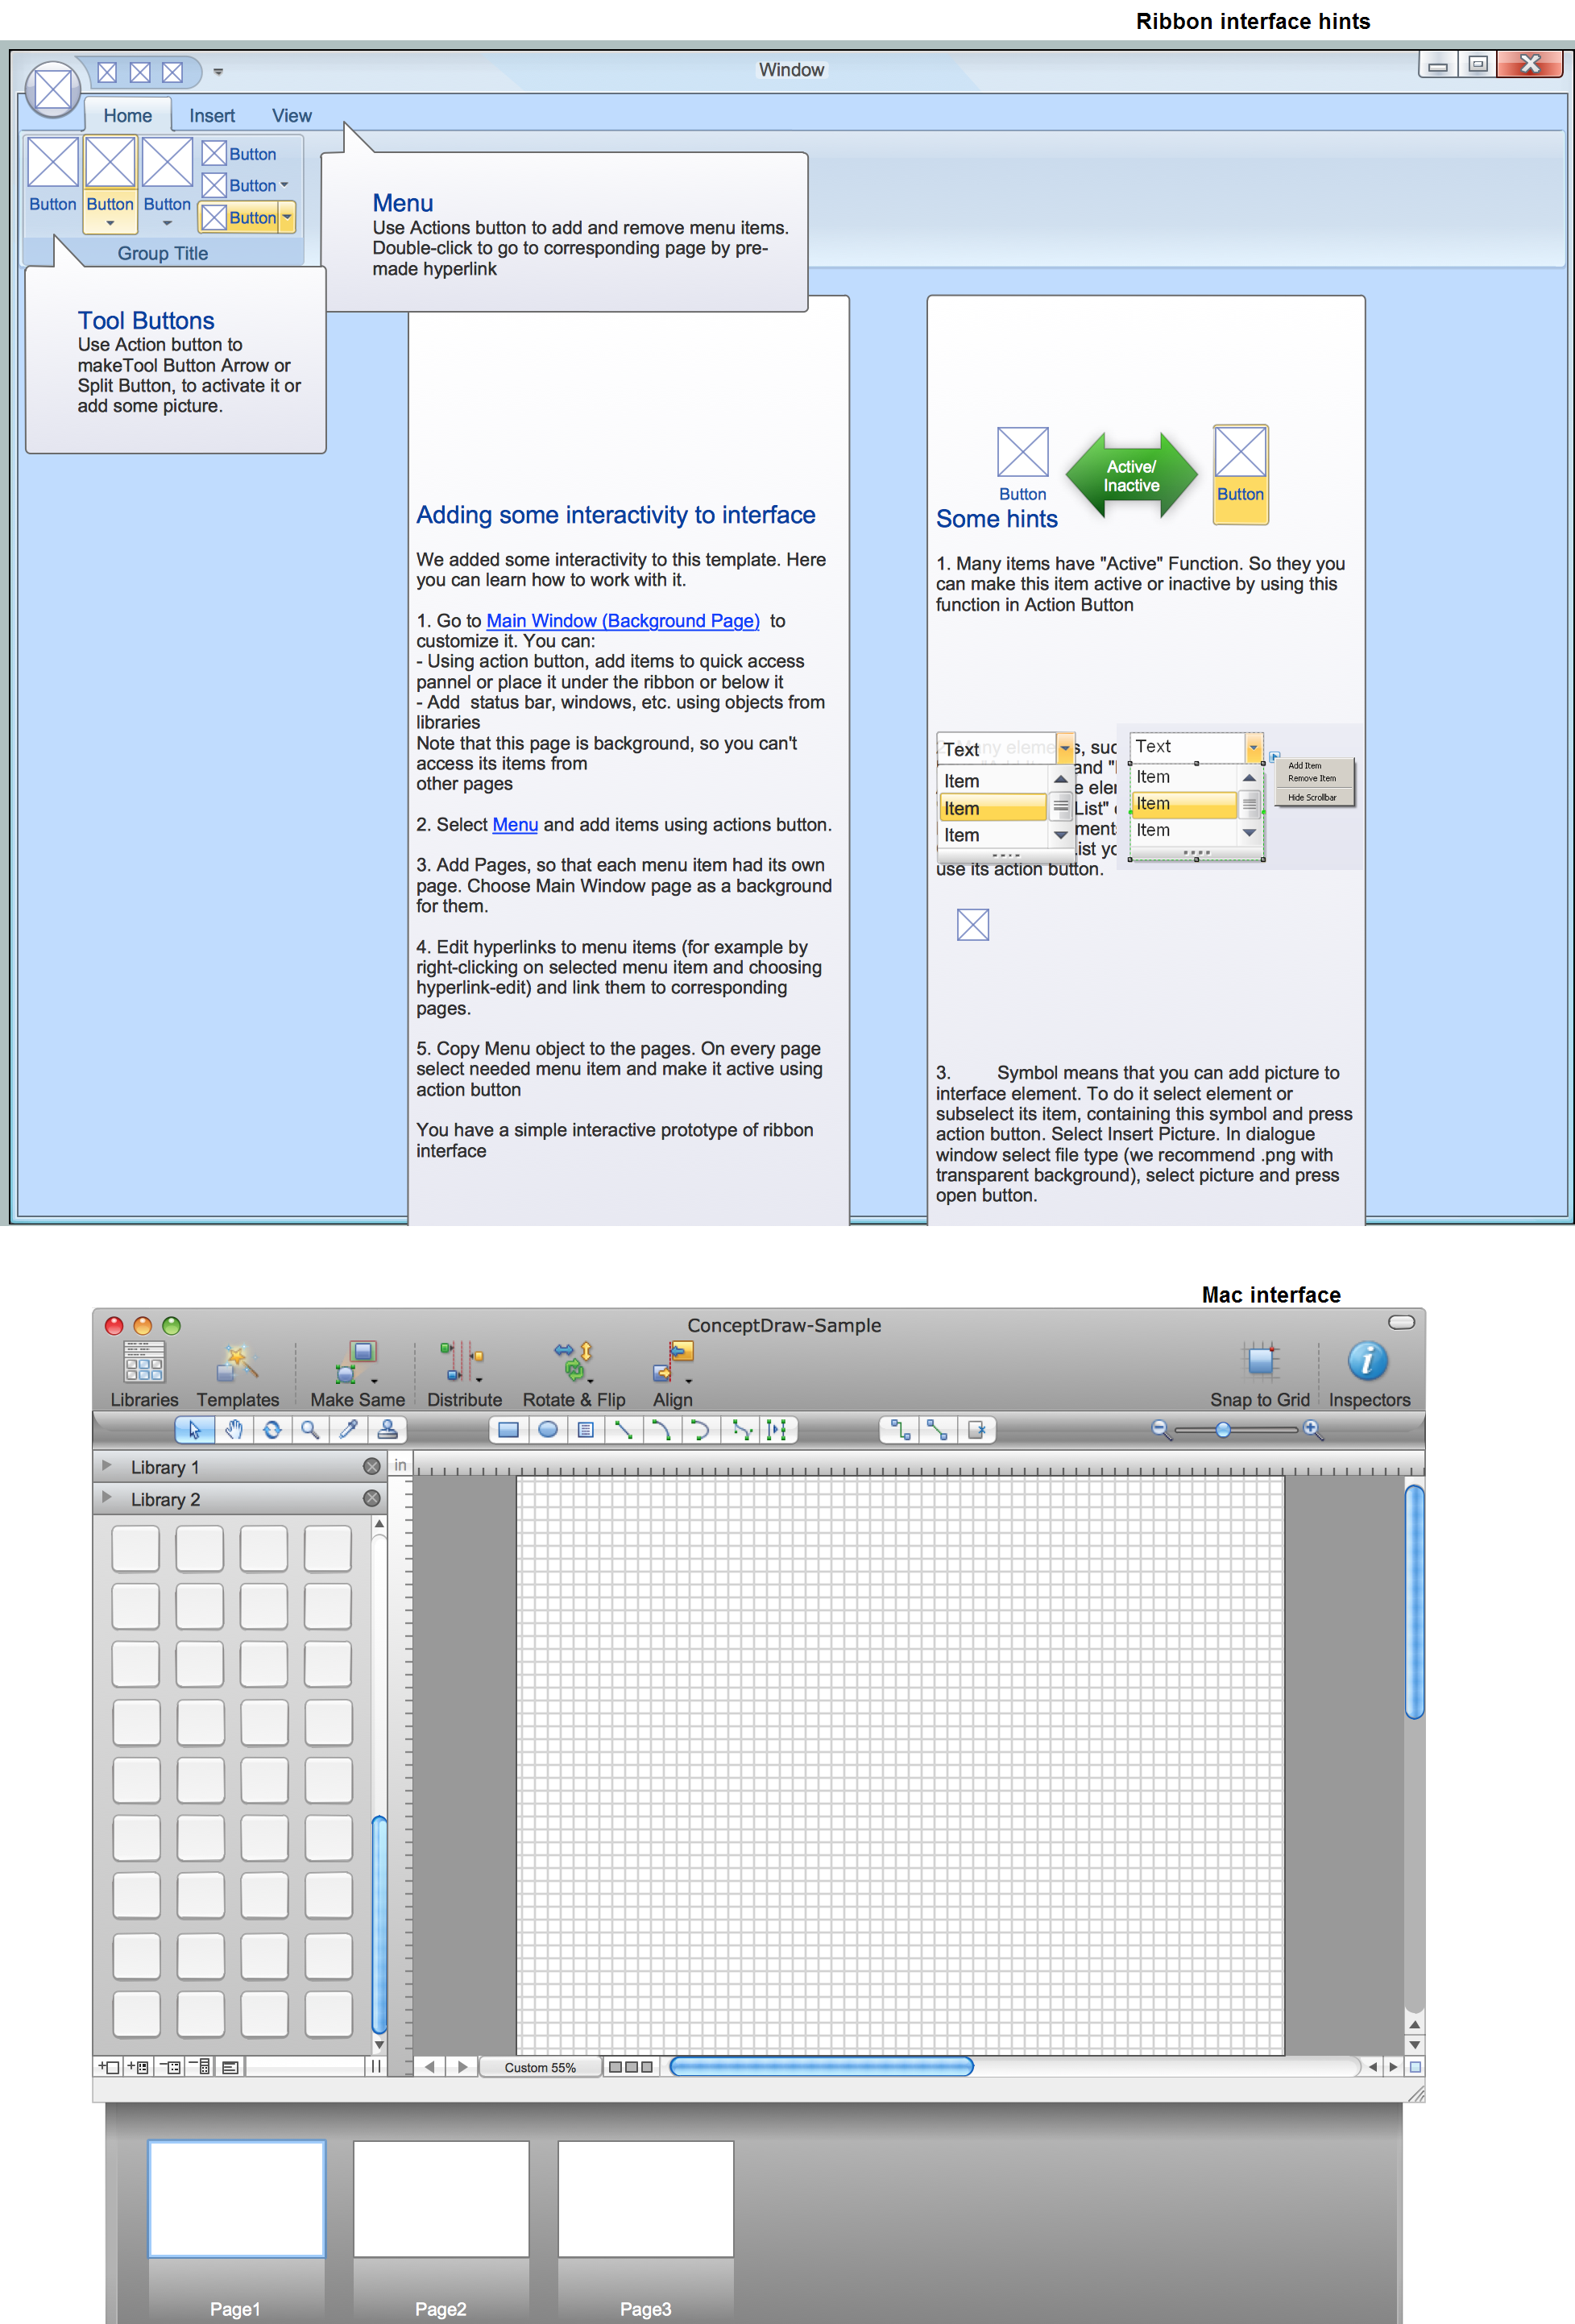
All about prototyping. GUI Prototyping with ConceptDraw. Download prototyping software.Illustration Software
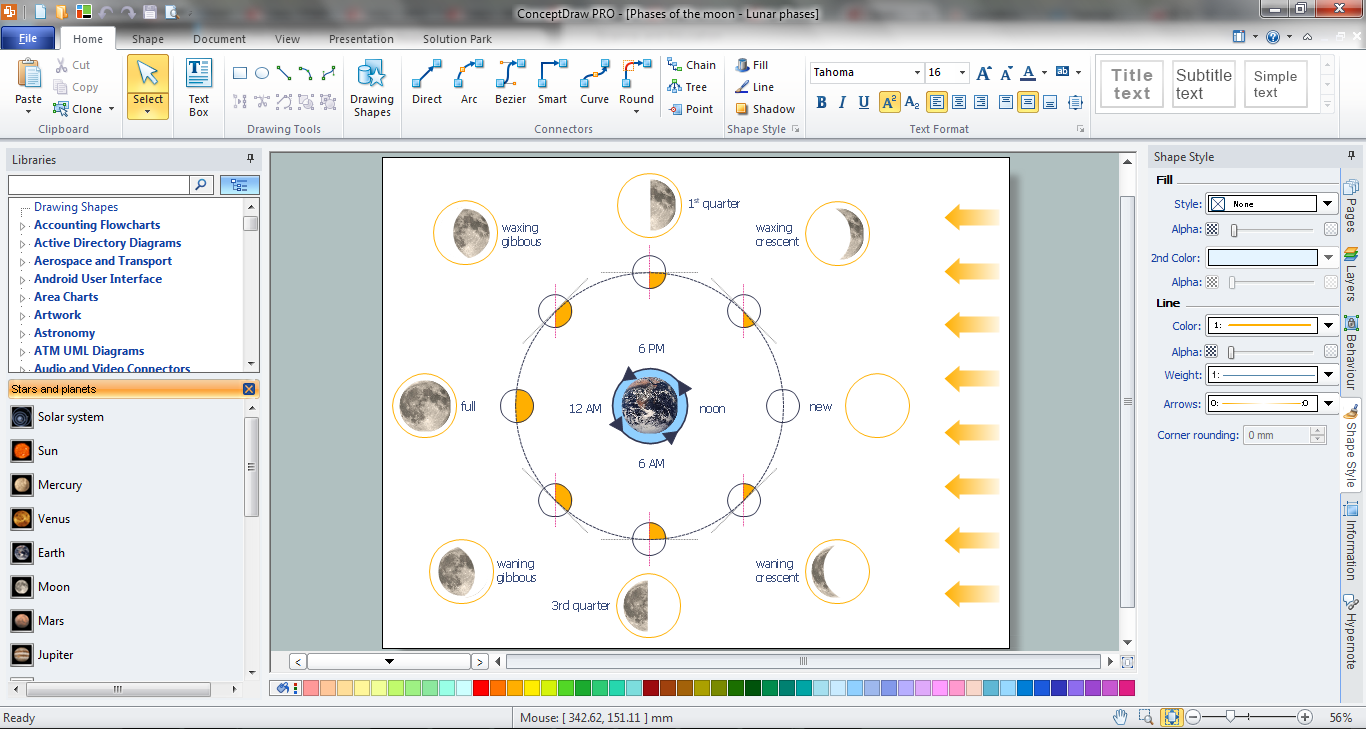
No science can't exist without illustrations, and especially astronomy! Illustrations help to visualize knowledge, natural phenomenons which are studied by astronomy, they equally effective help in work, during the learning process and on the conferences. Now we have professional astronomy illustration software - ConceptDraw DIAGRAM illustration and sketching software with templates, samples and libraries of a variety of astronomy symbols, including constellations, galaxies, stars, and planet vector shapes; a whole host of celestial bodies. When drawing scientific and educational astronomy illustrations, astronomy pictures and diagrams, can help you reach for the stars!Biology Drawing Software
Biology is incredibly interesting and useful natural science which studies all living things on the earth (people, animals, plants), structure, functions, interactions, evolution of living organisms. Biologists of the whole world use actively illustrations and drawings in your science and education activity. To facilitate their task of biology drawing, ConceptDraw DIAGRAM diagramming and vector drawing software was extended with Biology solution from the Science and Education area. Now, ConceptDraw DIAGRAM is a powerful biology drawing software.HelpDesk
How to a Draw Biology Diagram
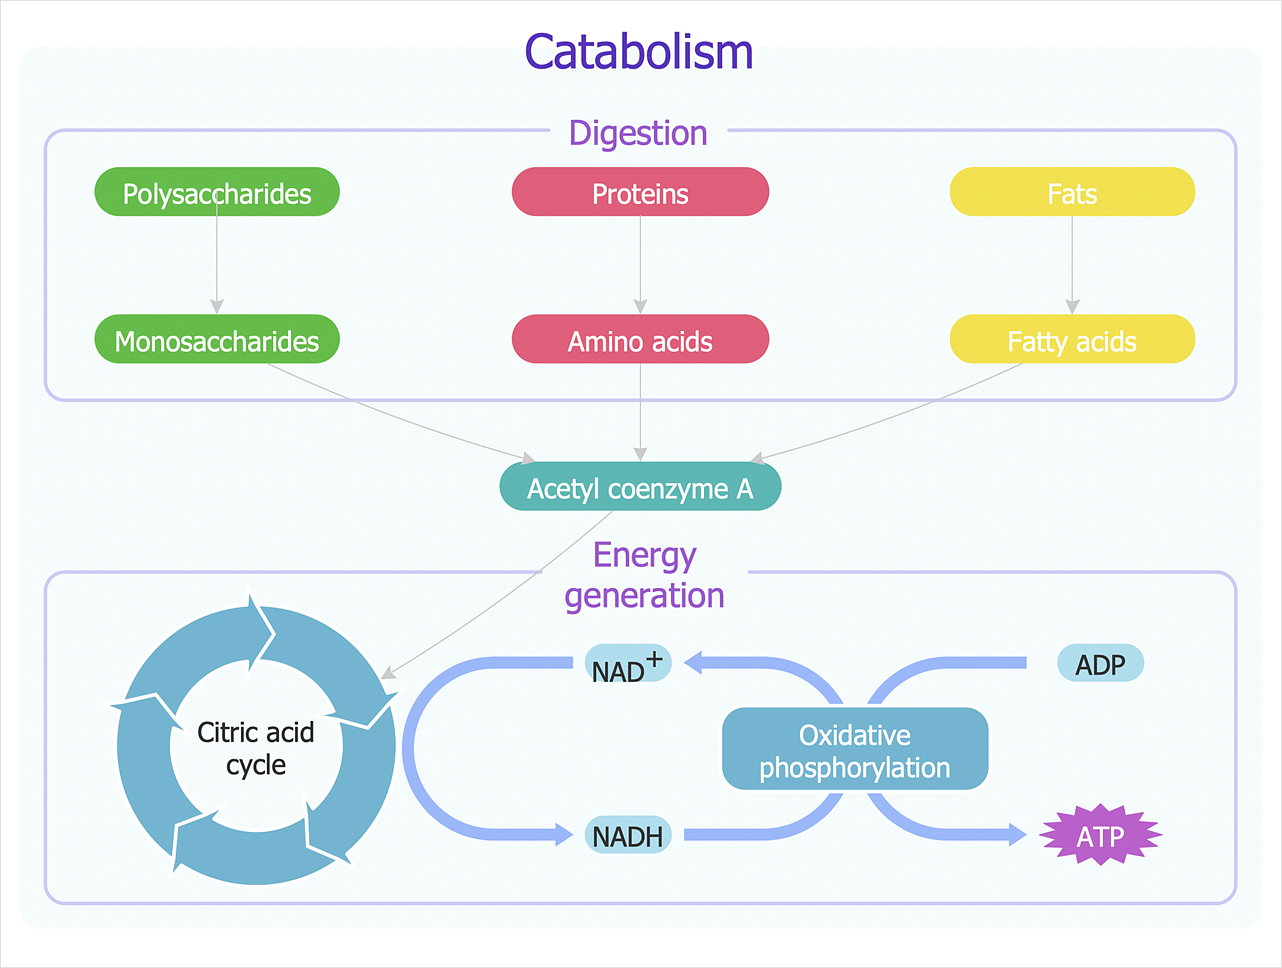
Biology is the science studying the living forms of life. A good starting point when studying biology is to use drawings. Drawings help students to comprehend and remember knowledge that is difficult to explain and understand. Students are used to drawing various specific diagrams such as the human circulatory systems or schemes of various biochemical processes. Researchers also need to complete their work with a variety of related diagrams and illustrations. ConceptDraw Biology solution allows you to draw various biological diagrams and schemes easily.
 Biology
Biology solution extends ConceptDraw DIAGRAM software with samples, templates and libraries containing biological vector symbols, to help you create scientific and educational designs in the field of biology.
- Chemistry Drawings | Bio Flowchart Lite | Bio Flowchart ...
- Cubetto Flowchart | Flowchart by Hapman | Bio Flowchart Lite ...
- Bio Flowchart Lite | ConceptDraw Solution Park | Biology | Best ...
- Bio Flowchart Lite | Software development with ConceptDraw PRO ...
- Top 5 Android Flow Chart Apps | DroidDia prime | Bio Flowchart ...
- Basic Flowchart Symbols and Meaning | Process Flowchart | Bio ...
- How to Draw Biology Diagram in ConceptDraw PRO | Biology | Bio ...
- Bio Flowchart Lite | Process Flowchart | Bio Flowchart | How To ...
- Bio Flowchart Lite | Business Diagram Software | Types of Flowchart ...
- Bio Flowchart Lite | Bio Flowchart | LLNL Flow Charts | Images Of ...
- Basic Flowchart Images. Flowchart Examples | Basic Flowchart ...
- Flowchart by Hapman | Bio Flowchart Lite | Cubetto Flowchart | Ipad ...
- Bio Flowchart Lite | Bio Flowchart | Flowchart Software | Flow Chat ...
- Bio Flowchart Lite | Biology Illustration | Best Value Stream Mapping ...
- Top iPad Business Process Diagrams Apps | Cubetto Flowchart | Bio ...
- Top 5 Android Flow Chart Apps | Cubetto Flowchart | Bio Flowchart ...
- Bio Flowchart Lite | How to Draw Biology Diagram in ConceptDraw ...
- Bio Flowchart Lite | Catabolism schematic - Biochemical diagram ...
- Bio Flowchart Lite | Bio Flowchart | How to Draw Biology Diagram in ...
- Bio Flowchart Lite | ConceptDraw Solution Park | Business Diagram ...


