Marketing Analysis Diagram

What is SWOT Analysis in Marketing

 Logistics Flow Charts
Logistics Flow Charts solution extends ConceptDraw DIAGRAM functionality with opportunities of powerful logistics management software. It provides large collection of predesigned vector logistic symbols, pictograms, objects and clipart to help you design with pleasure Logistics flow chart, Logistics process flow diagram, Inventory flow chart, Warehouse flowchart, Warehouse management flow chart, Inventory control flowchart, or any other Logistics diagram. Use this solution for logistics planning, to reflect logistics activities and processes of an enterprise or firm, to depict the company's supply chains, to demonstrate the ways of enhancing the economic stability on the market, to realize logistics reforms and effective products' promotion.
Business diagrams & Org Charts with ConceptDraw DIAGRAM


Sales Growth. Bar Graphs Example

 Cross-Functional Flowcharts
Cross-functional flowcharts are powerful and useful tool for visualizing and analyzing complex business processes which requires involvement of multiple people, teams or even departments. They let clearly represent a sequence of the process steps, the order of operations, relationships between processes and responsible functional units (such as departments or positions).
Fishbone Diagram Problem Solving

Business Tools Perceptual Mapping

Accounts Payable Flowchart

Definition TQM Diagram

Fishbone Diagram Procedure

Improving Problem Solving and Focus with Fishbone Diagrams

Horizontal Org Flow Chart

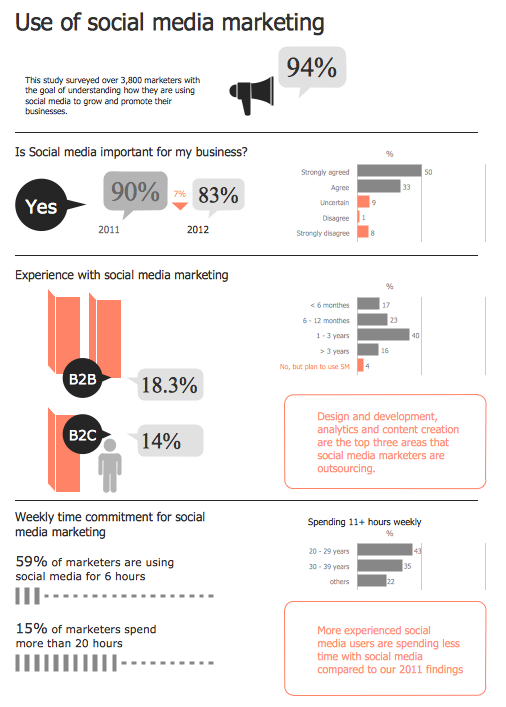
Social Media Marketing Infographic
- Competitor Analysis | Marketing | SWOT analysis matrix diagram ...
- Coffee Step By Step Flowchart
- Operation Process Using Flowchart Coffee Shop
- Flowchart Example: Flow Chart of Marketing Analysis | Marketing ...
- Process Chart For Coffee Cafe
- Coffee Shop Marketing Plan Sample
- What is SWOT Analysis in Marketing | SWOT analysis Software ...
- Marketing Plan Sample For Coffee Shop
- Total Quality Management Value | Process Flowchart | Marketing ...
- Ansoff Matrix | Competitor Analysis | Marketing | Ansoff ...
- Competitor Analysis | Target market | Flowchart Example: Flow Chart ...
- Marketing Diagrams | Flowchart Marketing Process. Flowchart ...
- Process Flowchart | Marketing Plan Infographic | Mind Maps for ...
- Value Stream Mapping | What is SWOT Analysis in Marketing | Mind ...
- What Is a Concept Map | Concept Maps | Internet marketing ...
- Process Flowchart | Basic Flowchart Symbols and Meaning | Flow ...
- Positioning Marketing
- How to Create Marketing Infographics | Marketing | Flowchart ...
- Process Flowchart | Marketing Research Project | How To Do A ...
- HVAC Marketing Plan | Marketing Plan Infographic | Marketing Flow ...