This flow chart sample was drawn on the base on the illustration of the article "Climate change impact on China food security in 2050" from the website of Chinese Academy of Agricultural Sciences .
[caas.cn/ en/ newsroom/ research_ update/ 67347.shtml]
"Food security is a condition related to the ongoing availability of food. ...
According to the Food and Agriculture Organization (FAO), food security "exists when all people, at all times, have physical and economic access to sufficient, safe and nutritious food to meet their dietary needs and food preferences for an active and healthy life". ...
Extreme events, such as droughts and floods, are forecast to increase as climate change takes hold. Ranging from overnight floods to gradually worsening droughts, these will have a range of impacts on the agricultural sector. ...
According to the Climate & Development Knowledge Network report Managing Climate Extremes and Disasters in the Agriculture Sectors: Lessons from the IPCC SREX Report, the impacts will include changing productivity and livelihood patterns, economic losses, and impacts on infrastructure, markets and food security. Food security in future will be linked to our ability to adapt agricultural systems to extreme events." [Food security. Wikipedia]
The flowchart example "Food security assessment" was created using the ConceptDraw PRO diagramming and vector drawing software extended with the Flowcharts solution from the area "What is a Diagram" of ConceptDraw Solution Park.
 Flowcharts
The Flowcharts Solution for ConceptDraw PRO v10 is a comprehensive set of examples and samples in several different color themes for professionals that need to graphically represent a process. Solution value is added by basic flow chart template and shapes' library of Flowchart notation. ConceptDraw PRO flow chart creator lets one depict a processes of any complexity and length, as well design of the flowchart either vertically or horizontally.
HelpDesk
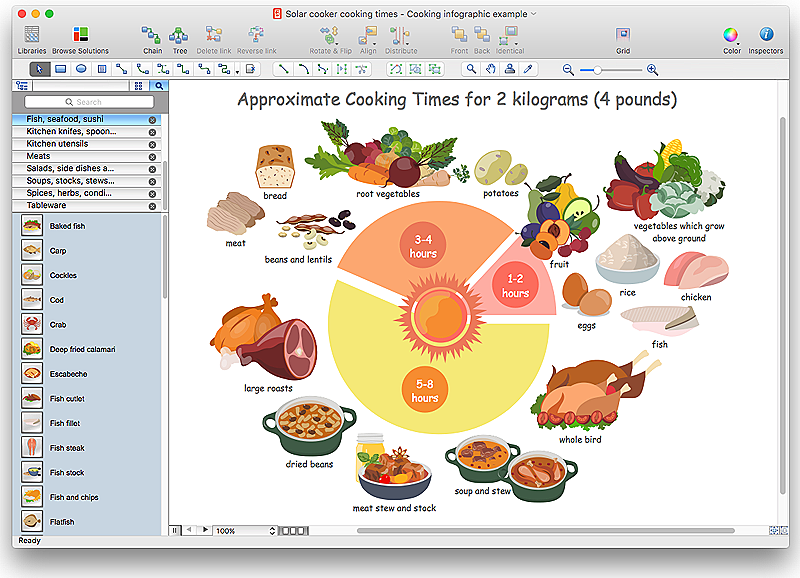
How to Design a Food-related Infographics Using ConceptDraw PRO
Today a large piece of business is referred to a food. This business can not be imagined without various kinds of visualizations. You can see them everywhere — on brand logos, in advertising, on menus and in flyers. Also different food related infographics is used to promote healthy nutrition and to deliver information on how to maintain an effective diet. ConceptDraw Cooking Recipes solution, offers a great collection of bright food-related images and icons, placed into themed libraries. It can be used for catering menu graphics, on marketing flyers, or as concomitant text for infographics.
 Cross-Functional Flowcharts
Cross-functional flowcharts are powerful and useful tool for visualizing and analyzing complex business processes which requires involvement of multiple people, teams or even departments. They let clearly represent a sequence of the process steps, the order of operations, relationships between processes and responsible functional units (such as departments or positions).
- Flowchart In Food Engineering
- Definition Of Flow Chart In Food Processing
- Food security assessment - Flowchart | Flowcharts | Contoh ...
- Flowcharts | Food security assessment - Flowchart | Food Court ...
- Flow Chart On Components Of Food
- Food security assessment - Flowchart | Technical Flow Chart ...
- Draw A Flow Chart Of Food Food Flow In Sequence
- Flowcharts | Food security assessment - Flowchart | Flowchart ...
- Food Court | Health Food | How to Design a Food -related ...
- Healthy Diet Plan | Flowchart Examples and Templates | Healthy ...
- Contoh Flowchart | Create Organizational Chart | Gantt Chart About ...
- Fast Food Marketing Flowchart
- Food security assessment - Flowchart | Weather - Vector stencils ...
- Healthy Foods | Health Food | Healthy Meal Recipes | Flow Chart Of ...
- Healthy Food Ideas | Food security assessment - Flowchart | Healthy ...
- Food security assessment - Flowchart | Contoh Flowchart | Cisco ...
- Food security assessment - Flowchart | Opportunities in agro and ...
- Flow chart Example. Warehouse Flowchart | Process Engineering ...
- Flow Chart Of Components Of Food
- Basic Flowchart Symbols and Meaning | Cafe and Restaurant Floor ...

