Flowchart Marketing Process. Flowchart Examples

 Logistics Flow Charts
Logistics Flow Charts solution extends ConceptDraw PRO v11 functionality with opportunities of powerful logistics management software. It provides large collection of predesigned vector logistic symbols, pictograms, objects and clipart to help you design with pleasure Logistics flow chart, Logistics process flow diagram, Inventory flow chart, Warehouse flowchart, Warehouse management flow chart, Inventory control flowchart, or any other Logistics diagram. Use this solution for logistics planning, to reflect logistics activities and processes of an enterprise or firm, to depict the company's supply chains, to demonstrate the ways of enhancing the economic stability on the market, to realize logistics reforms and effective products' promotion.
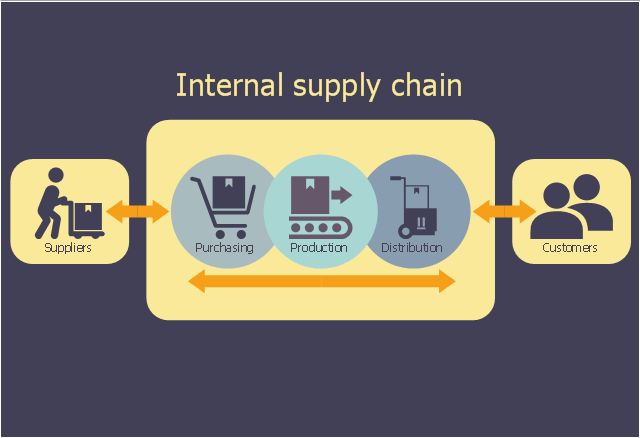
This logistic flow chart sample shows the company's supply chain. It was designed on the base of the Wikimedia Commons file: A company's supply chain (en).png. [commons.wikimedia.org/ wiki/ File:A_ company%27s_ supply_ chain_ (en).png]
This file is licensed under the Creative Commons Attribution-Share Alike 3.0 Unported license. [creativecommons.org/ licenses/ by-sa/ 3.0/ deed.en]
"A supply chain is a system of organizations, people, activities, information, and resources involved in moving a product or service from supplier to customer. Supply chain activities involve the transformation of natural resources, raw materials, and components into a finished product that is delivered to the end customer. In sophisticated supply chain systems, used products may re-enter the supply chain at any point where residual value is recyclable. Supply chains link value chains." [Supply chain. Wikipedia]
The logistic flowchart example "A company's supply chain" was created using ConceptDraw PRO diagramming and vector drawing software extended with the Logistics Flow Charts solution from the Business Processes area of ConceptDraw Solution Park.
Logistic flowchart
Process Flowchart


Process Flow Diagram Symbols

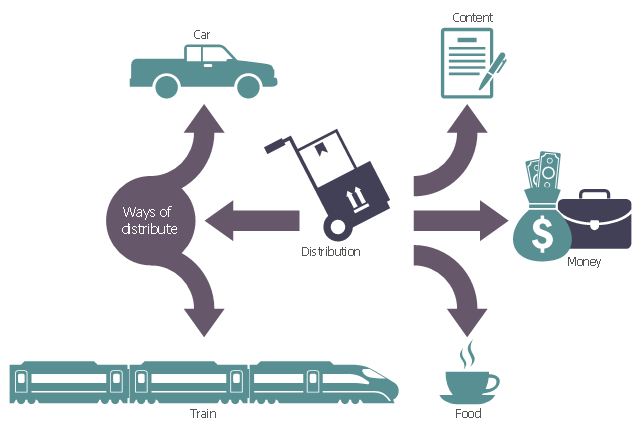
This logistic flow chart sample illustrates the distribution as economics term.
It was designed on the base of the Wikimedia Commons file: 46v1 New-Sheet.jpg.
[commons.wikimedia.org/ wiki/ File:46v1_ New-Sheet.jpg]
"Distribution in economics refers to the way total output, income, or wealth is distributed among individuals or among the factors of production (such as labour, land, and capital). In general theory and the national income and product accounts, each unit of output corresponds to a unit of income. One use of national accounts is for classifying factor incomes and measuring their respective shares, as in National Income. But, where focus is on income of persons or households, adjustments to the national accounts or other data sources are frequently used. Here, interest is often on the fraction of income going to the top (or bottom) x percent of households, the next y percent, and so forth (say in quintiles), and on the factors that might affect them (globalization, tax policy, technology, etc.)." [Distribution (economics). Wikipedia]
The logistic flowchart example "Distribution mind map" was created using ConceptDraw PRO diagramming and vector drawing software extended with the Logistics Flow Charts solution from the Business Processes area of ConceptDraw Solution Park.
Logistic flowchart
Work Order Process Flowchart. Business Process Mapping Examples

Flow Chart Symbols

Flow chart Example. Warehouse Flowchart


Example of DFD for Online Store (Data Flow Diagram) DFD Example


- Er Diagram For Production And Distribution Management System
- How to Make a Logistics Flow Chart | Production Flow
- Simple Products Marketing And Distribution Process Flow Chart
- Sales Distribution Flow Chart
- Distribution Planning Of A Product By A Flow Chart
- Process Flow Diagram Symbols | Production Flow Chart In Plastic ...
- Distribution Process Flow Chart
- Flowchart Plan Production Facility
- Er Diagram Of Manufacturing Industry
- Data Flow Diagram Model | How Do Fishbone Diagrams Solve ...