Basic Flowchart Symbols and Meaning
Flowcharts are the best for visually representation the business processes and the flow of a custom-order process through various departments within an organization. ConceptDraw PRO diagramming and vector drawing software extended with Flowcharts solution offers the full set of predesigned basic flowchart symbols which are gathered at two libraries: Flowchart and Flowcharts Rapid Draw. Among them are: process, terminator, decision, data, document, display, manual loop, and many other specific symbols. The meaning for each symbol offered by ConceptDraw gives the presentation about their proposed use in professional Flowcharts for business and technical processes, software algorithms, well-developed structures of web sites, Workflow diagrams, Process flow diagram and correlation in developing on-line instructional projects or business process system. Use of ready flow chart symbols in diagrams is incredibly useful - you need simply drag desired from the libraries to your document and arrange them in required order. There are a few serious alternatives to Visio for Mac, one of them is ConceptDraw PRO. It is one of the main contender with the most similar features and capabilities.
IDEF0 standard with ConceptDraw PRO
The activity of any organization is more or less branchy network of processes. The description of these processes is a hard technical task which requires definite methodology and standards. According to the IDEF0 standard any process can be described in the form of a block (Activity Box) which has inputs and outputs. The process consists in transformation of inputs into outputs under the influence of the management and in the presence of necessary resources. Outputs of the given process later on can be either inputs for the next process or resources, or management means.Illustrate the Computer Network of a Building
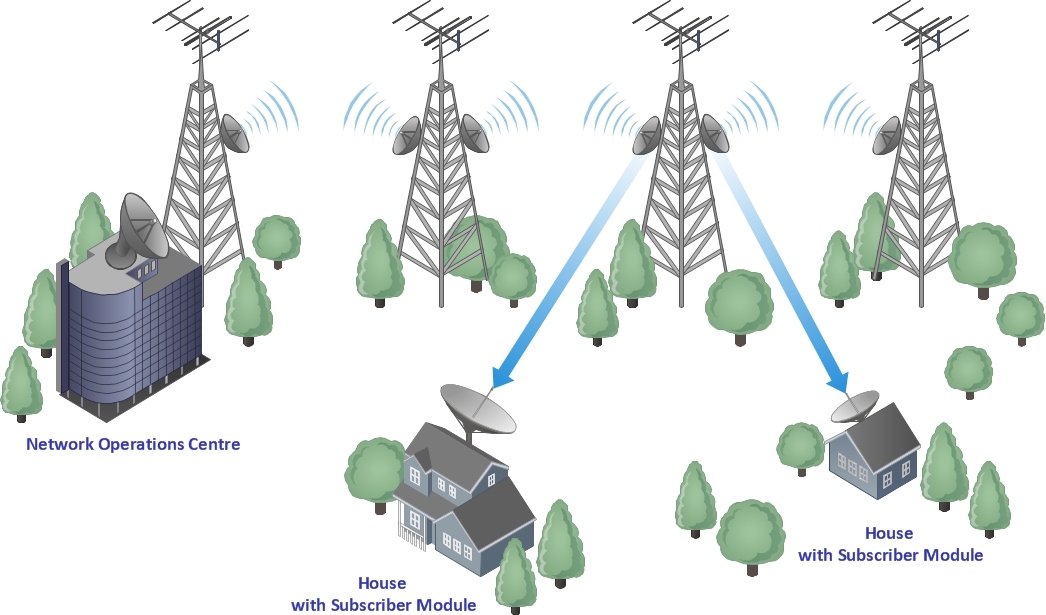
With best content of the Wireless Network solution that includes more than 10 building pre-designed objects network engineers can illustrate the computer network of a building.
 Interactive Voice Response Diagrams
Interactive Voice Response Diagrams solution extends ConceptDraw PRO v10 software with samples, templates and libraries of ready-to-use vector stencils that help create Interactive Voice Response (IVR) diagrams illustrating in details a work of interactive voice response system, the IVR system’s logical and physical structure, Voice-over-Internet Protocol (VoIP) diagrams, and Action VoIP diagrams with representing voice actions on them, to visualize how the computers interact with callers through voice recognition and dual-tone multi-frequency signaling (DTMF) keypad inputs.
Network Topologies
Network topology is a topological structure of computer network, which can be physical or logical. The physical topology depicts location of different computer network elements such as computers, cables and other devices. The logical topology visually displays network dataflows from one device to another. Sometimes network logical and physical topologies can be the same. ConceptDraw PRO diagramming and vector drawing software is powerful for drawing network maps and network topologies diagrams of any kinds and complexity thanks to the Computer Network Diagrams solution from the Computer and Networks area. ConceptDraw STORE proposes collection of network icons libraries and a lot of Network Topology Diagram examples, samples and templates which were created at ConceptDraw PRO software specially for Computer Network Diagrams solution. There are six basic types of the network topologies: Bus, Star, Ring, Mesh, Tree, Fully Connected. You can fast and easy design professional-looking diagram for each of them using the ConceptDraw PRO tools. There are plenty of web Visio-like diagramming software available. Web based diagrams software can be powerful, but sometimes it is essential to have desktop software. One of the most advanced diagrams tools like Visio for Mac OS is ConceptDraw PRO app.
TQM Diagram Tool
The Total Quality Management Diagram solution helps you and your organization visualize business and industrial processes. Create Total Quality Management diagrams for business process with ConceptDraw software.HelpDesk
How to Create an Effective Mind Map Using Topic Types
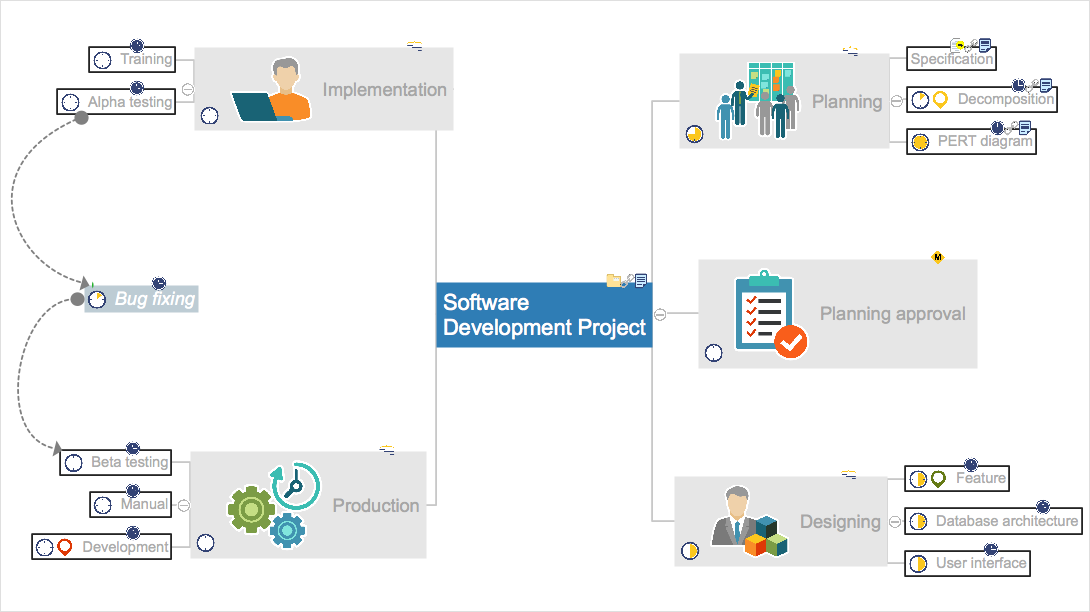
Tips on how to increase mind map effectiveness using Topic Types functionality, delivered with ConceptDraw MINDMAP.
 Accounting Flowcharts
Accounting Flowcharts solution extends ConceptDraw PRO software with templates, samples and library of vector stencils for drawing the accounting flow charts.
 ConceptDraw Solution Park
ConceptDraw Solution Park collects graphic extensions, examples and learning materials
Computer Networking Tools List
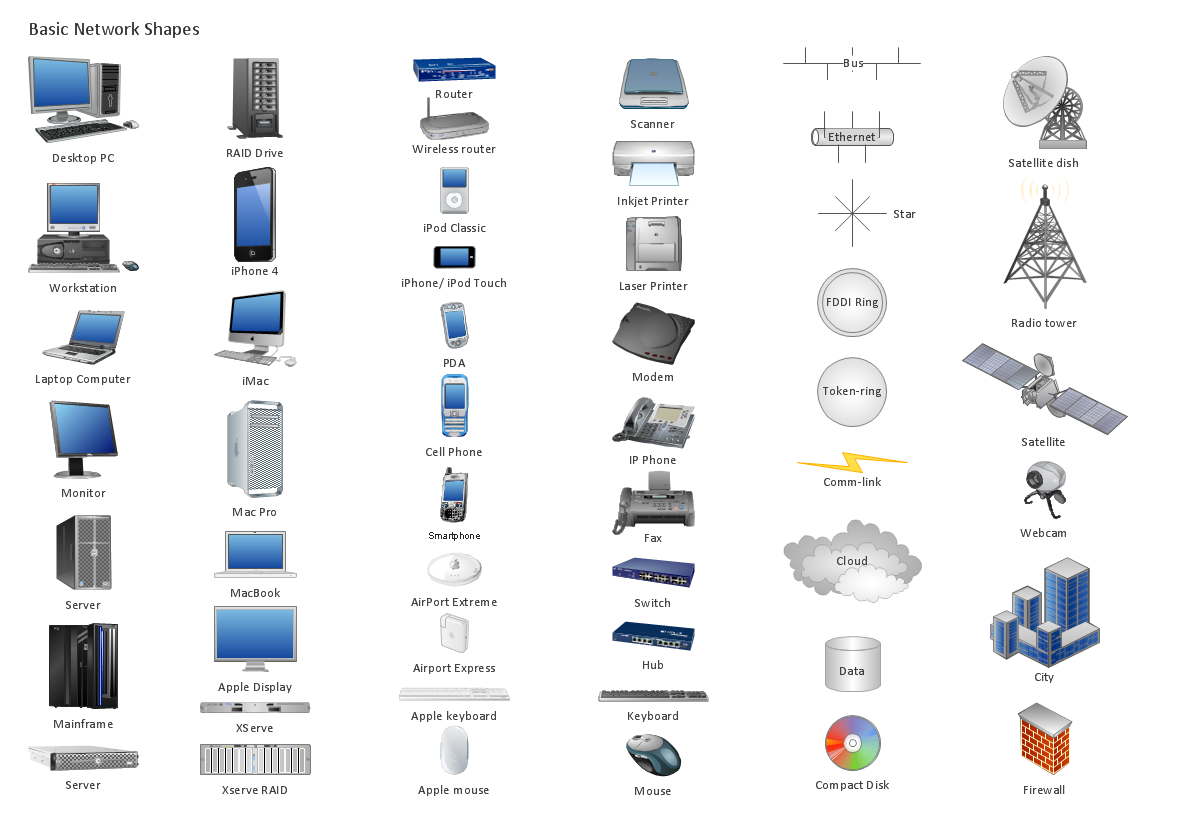
Network Diagrams visualize schematically the computer networks topology, equipment nodes and different types of their logical and physical connections. They are widely used by IT professionals to visually document the topology and design of computer and telecommunication networks.
 Entity-Relationship Diagram (ERD)
An Entity-Relationship Diagram (ERD) is a visual presentation of entities and relationships. That type of diagrams is often used in the semi-structured or unstructured data in databases and information systems. At first glance ERD is similar to a flowch
This IVR diagram sample illustrates how ENUM works by giving an example: Subscriber A sets out to call Subscriber B:
1. The User Agent of an ENUM-enabled subscriber terminal device, or a PBX, or a Gateway, translates the request for the number +34 98 765 4321 in accordance with the rule described in RFC 3761 into the ENUM domain 1.2.3.4.5.6.7.8.9.4.3.e164.arpa.
2. A request is sent to the Domain Name System (DNS) asking it to look up the ENUM domain 1.2.3.4.5.6.7.8.9.4.3.e164.arpa.
3. The query returns a result in the form of so called Naming Authority Pointer Resource NAPTR records, as per RFC 3403. In the example above, the response is an address that can be reached in the Internet using the VoIP protocol, SIP per RFC 3261.
4. The terminal application now sets up a communication link, and the call is routed via the Internet.
This IVR diagram sample was designed on the base of the Wikimedia Commons file: Ejemplo ENUM.jpg. [commons.wikimedia.org/ wiki/ File:Ejemplo_ ENUM.jpg]
"Being able to dial telephone numbers the way customers have come to expect is considered crucial for the convergence of classic telephone service (PSTN) and Internet telephony (Voice over IP, VoIP), and for the development of new IP multimedia services. The problem of a single universal personal identifier for multiple communication services can be solved with different approaches. One simple approach is the Electronic Number Mapping System (ENUM), developed by the IETF, using existing E.164 telephone numbers, protocols and infrastructure to indirectly access different services available under a single personal identifier. ENUM also permits connecting the IP world to the telephone system in a seamless manner." [Telephone number mapping. Wikipedia]
The IVR diagram example "Example ENUM" was designed using ConceptDraw PRO diagramming and vector drawing software extended with the Interactive Voice Response Diagrams solution from the Computer and Networks area of ConceptDraw Solution Park.
Rack Diagrams
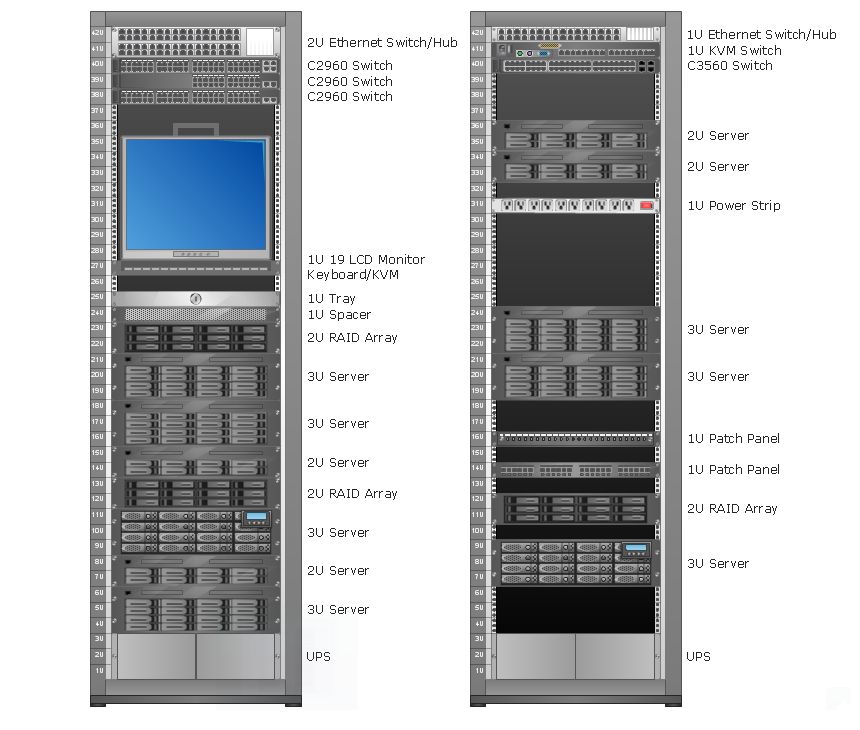
Rack Diagrams visualize the rack mounting of computer and network equipment as the drawing of frontal view of the rack with equipment installed. They are used for choosing the equipment or racks to buy, and help to organize equipment on the racks virtually, without the real installation.
- Basic Flowchart Symbols and Meaning | Process Flowchart | Types ...
- Flowchart on Bank. Flowchart Examples | Process Flowchart | How ...
- Computer System Is Design In Form Of Flow Charting To Help
- Computer System Is Design In Form Of Flow Charting To Help
- Flowchart on Bank. Flowchart Examples | Flowchart Examples and ...
- IVR time auto-attendant diagram | Cisco Multimedia, Voice , Phone ...
- Interactive Flow Chart
- Flow Chart Of Different Types Of Bank Accounts
- Process Flowchart | Block Diagrams | Audit Flowcharts | Block ...
- Sales Process Flowchart . Flowchart Examples | Basic Flowchart ...
- Difference In Man Type And Material Type Of Flow Chart
- Sample Project Flowchart . Flowchart Examples | Euclidean ...
- Interactive Voice Response Diagrams | Management | Process ...
- Map Infographic Creator | How to Create an Interactive Voice ...
- Process Flowchart | Structured Systems Analysis and Design ...
- IVR flowchart - Store reporting | How to Create an Interactive Voice ...
- Sample Project Flowchart . Flowchart Examples | Software Diagrams ...
- Flowchart Definition | Chemical and Process Engineering | How to ...
- IVR flowchart - Store reporting | Interactive Voice Response ...
- Basic Flowchart Symbols and Meaning | Process Flowchart | How to ...


