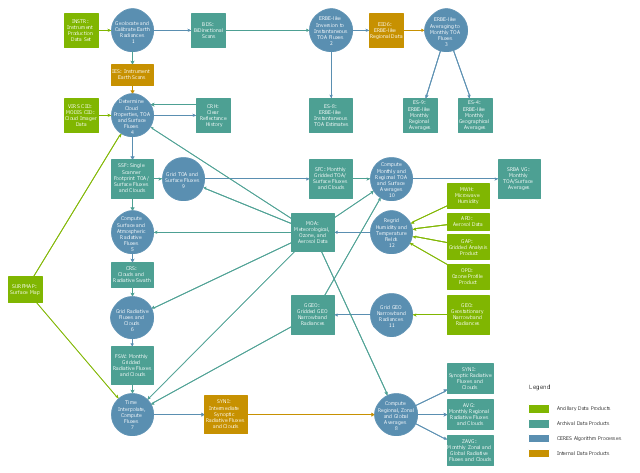
This DFD sample was created on the base of the figure from the NASA website. [asd-www.larc.nasa.gov/ ATBD/ DFD.html]
"Clouds and the Earth's Radiant Energy System (CERES).
EOS-Terra: Understanding Earth's Clouds and Climate.
The Clouds and the Earth's Radiant Energy System (CERES) instrument is one of several that will be flown aboard the Earth Observing System's Terra spacecraft, scheduled for launch in late1999. The data from the CERES instrument will be used to study the energy exchanged between the Sun; the Earth's atmosphere, surface and clouds; and outer space.
The CERES EOS-Terra instrument will be the second CERES instrument in Earth orbit. The first CERES instrument is currently orbiting the Earth aboard the Tropical Rainfall Measuring Mission observatory, which was launched in November 1997. Early results of the TRMM mission show that the first CERES has provided better measurement capabilities than any previous satellite instrument of its kind.
What CERES Will Measure.
CERES will measure the energy at the top of the atmosphere, as well as estimate energy levels in the atmosphere and at the Earth's surface. Using information from very high resolution cloud imaging instruments on the same spacecraft, CERES also will determine cloud properties, including cloud amount, altitude, thickness, and the size of the cloud particles. All of these measurements are critical for advancing our understanding of the Earth's total climate system and further improving climate prediction models.
The CERES instrument is based on NASA Langley's highly successful Earth Radiation Budget Experiment (ERBE) which used three satellites to provide global energy budget measurements from 1984 to 1990." [nasa.gov/ centers/ langley/ news/ factsheets/ CERES.html]
The DFD example "CERES data flow diagram" was created using the ConceptDraw PRO diagramming and vector drawing software extended with the Data Flow Diagrams solution from the Software Development area of ConceptDraw Solution Park.
Process Flowchart
The main reason of using Process Flowchart or PFD is to show relations between major parts of the system. Process Flowcharts are used in process engineering and chemical industry where there is a requirement of depicting relationships between major components only and not include minor parts. Process Flowcharts for single unit or multiple units differ in their structure and implementation. ConceptDraw PRO is Professional business process mapping software for making Process flowcharts, Process flow diagram, Workflow diagram, flowcharts and technical illustrations for business documents and also comprehensive visio for mac application. Easier define and document basic work and data flows, financial, production and quality management processes to increase efficiency of your business with ConcepDraw PRO. Business process mapping software with Flowchart Maker ConceptDraw PRO includes extensive drawing tools, rich examples and templates, process flowchart symbols and shape libraries, smart connectors that allow you create the flowcharts of complex processes, process flow diagrams, procedures and information exchange. Process Flowchart Solution is project management workflow tools which is part ConceptDraw Project marketing project management software. Drawing charts, diagrams, and network layouts has long been the monopoly of Microsoft Visio, making Mac users to struggle when needing such visio alternative like visio for mac, it requires only to view features, make a minor edit to, or print a diagram or chart. Thankfully to MS Visio alternative like ConceptDraw PRO software, this is cross-platform charting and business process management tool, now visio alternative for making sort of visio diagram is not a problem anymore however many people still name it business process visio tools.
Bar Diagrams for Problem Solving. Create space science bar charts with Bar Graphs Solution
Bar charts represent data in different categories or groups. Create bar graphs for visual solving your scientific problems and data comparison using the ConceptDraw PRO diagramming and vector drawing software extended with the Bar Graphs Solution from the Graphs and Charts area of ConceptDraw Solition Park.Geo Map - Africa
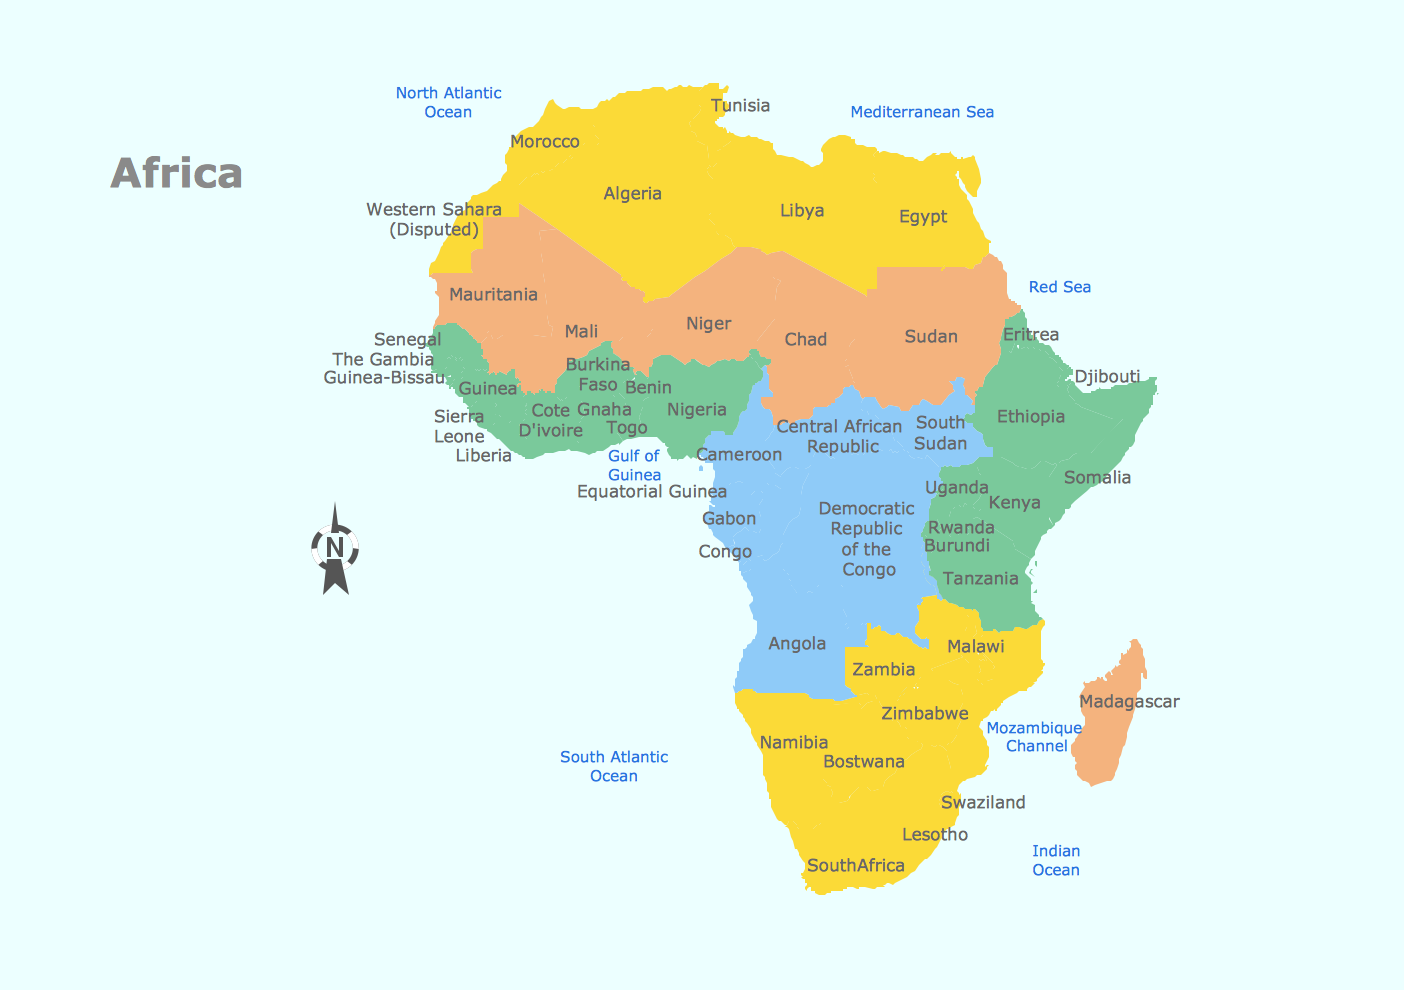
Africa has 54 fully recognized sovereign states, 9 territories and two de facto independent states with limited or no recognition. Vector design elements library Africa contains country map contours, geographical maps, cartograms and thematic maps for ConceptDraw PRO diagramming and vector drawing software. To help visualize the business and thematic information connected with geographic areas, locations or customs. All ConceptDraw PRO documents are vector graphic files and are available for reviewing, modifying, and converting to a variety of formats: image, HTML, PDF file, MS PowerPoint Presentation, Adobe Flash, MS Visio (.VDX, .VSDX).Astronomy Symbols
Are you an astronomer, astronomy teacher or student? And you need to draw astronomy pictures quick and easy? ConceptDraw PRO diagramming and vector drawing software extended with Astronomy solution from the Science and Education area will help you! Astronomy solution provides 7 libraries with wide variety of predesigned vector objects of astronomy symbols, celestial bodies, solar system symbols, constellations, etc.Map of Continents
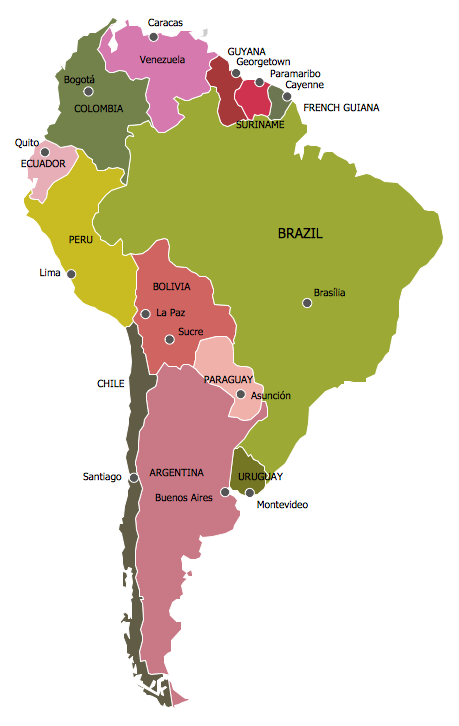
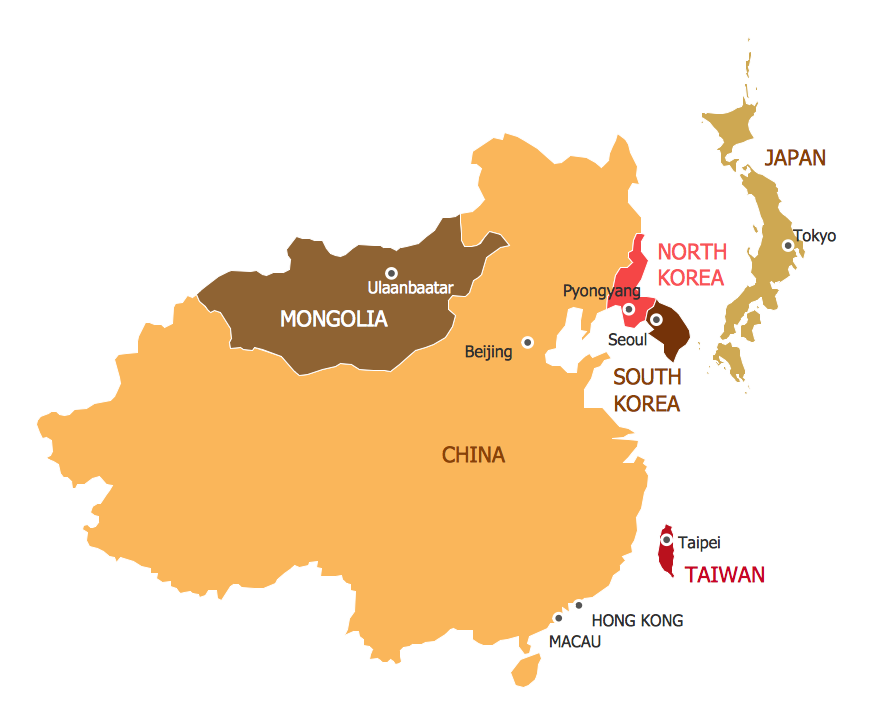
A continent is one of several very large landmasses on Earth. ConceptDraw PRO diagramming and vector drawing software offers the unique Continent Maps Solution from the Maps Area which is indispensable for drawing the map of continents of the Earth.The Best Drawing Program for Mac
ConceptDraw PRO is the professional business graphic software for drawing diagrams and charts with great visual appeal on Mac OS X.Geo Map of Americas
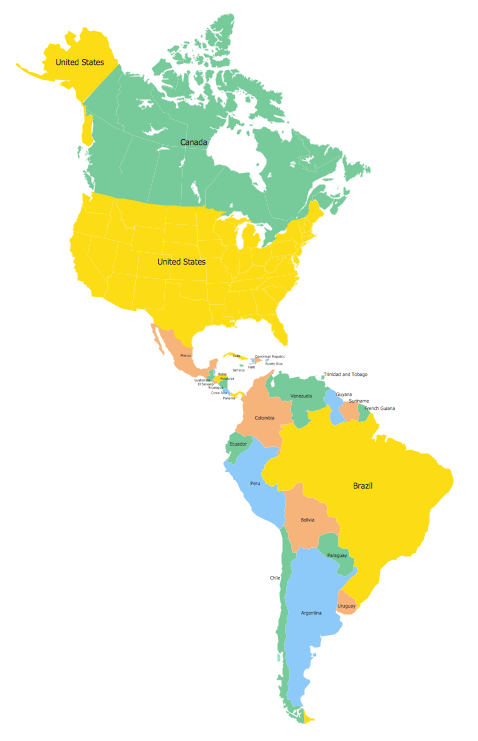
The Americas are the combined continental landmasses of North America and South America, in the Western Hemisphere. There are 35 sovereign states in the Americas. ConceptDraw is idea to draw the geological maps of America from the pre-designed vector geo map shapes and vector images map of america. Use Continent Maps solution from the Maps area of ConceptDraw Solution Park to draw thematic maps, geospatial infographics and vector illustrations for your business documents, presentations and websites.7 Continents Map
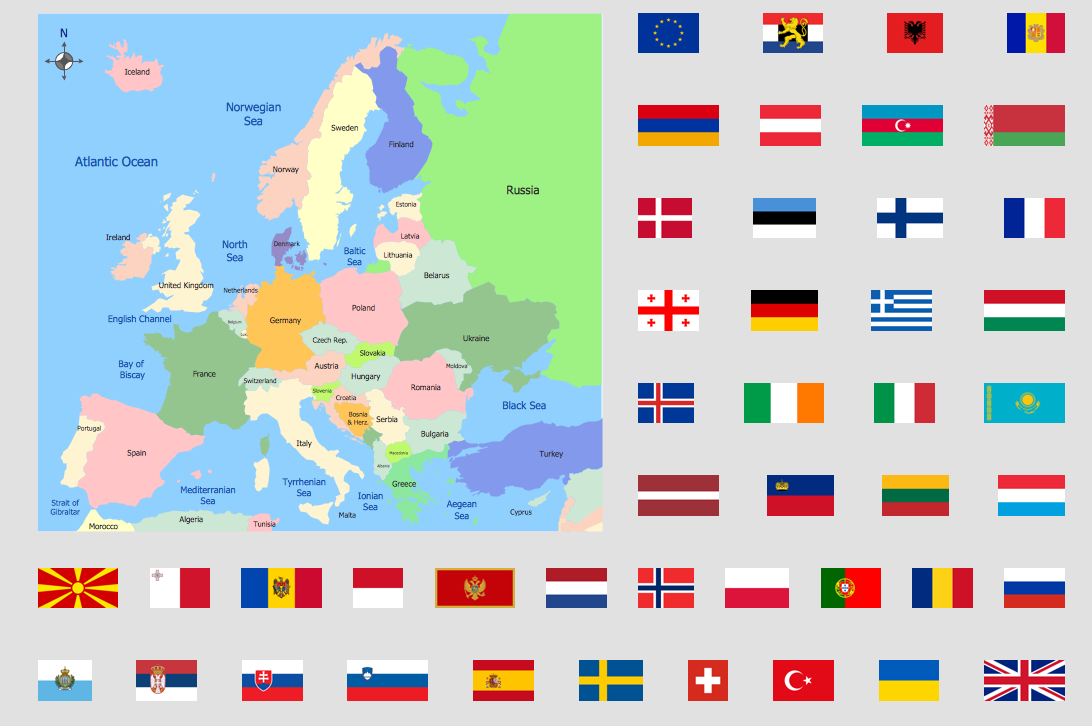
A continent is a large area of land washed by the seas. There are 7 continents on the Earth: Asia, Africa, North America, South America, Antarctica, Europe, and Australia. If you want create the 7 Continents Map, we offer you incredibly useful tool for this - ConceptDraw PRO diagramming and vector drawing software extended with Continent Maps Solution from the Maps Area of ConceptDraw Solution Park.World Continents Map
ConceptDraw PRO diagramming and vector drawing software enhanced with Continent Maps Solution from the Maps Area is the best for drawing geographic, topography, political, and many other kinds of maps for any of seven earth continents and also world continents map of any detailing.Geo Map - Africa - Madagascar
Madagascar, officially the Republic of Madagascar, is an island country in the Indian Ocean, off the coast of Southeast Africa. The vector stencils library Madagascar contains contours for ConceptDraw PRO diagramming and vector drawing software. This library is contained in the Continent Maps solution from Maps area of ConceptDraw Solution Park.Geo Map - Asia - Philippines
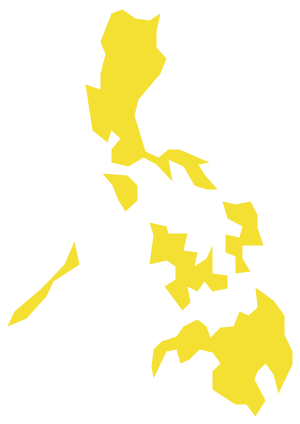
The Philippines, officially known as the Republic of the Philippines, is a sovereign island country in Southeast Asia situated in the western Pacific Ocean. Use the Continent Maps solution and Philippines library to draw thematic maps, geospatial infographics and vector illustrations. This solution to help visualize the business and thematic information connected with geographic areas, locations or customs; for your business documents, presentations and websites.Geo Map - Europe - Ireland
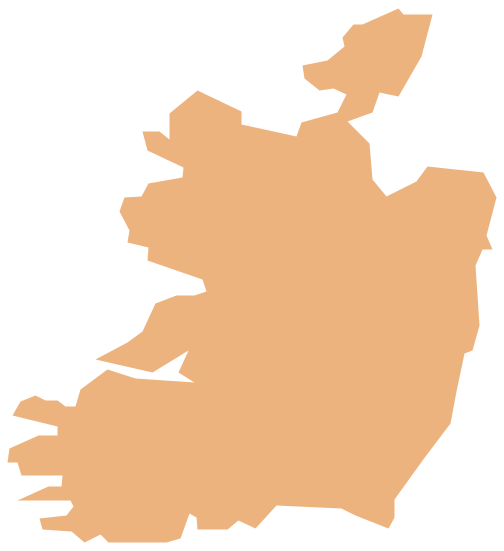
The vector stencils library Ireland contains contours for ConceptDraw PRO diagramming and vector drawing software. This library is contained in the Continent Maps solution from Maps area of ConceptDraw Solution Park.Geo Map - Europe - Russia
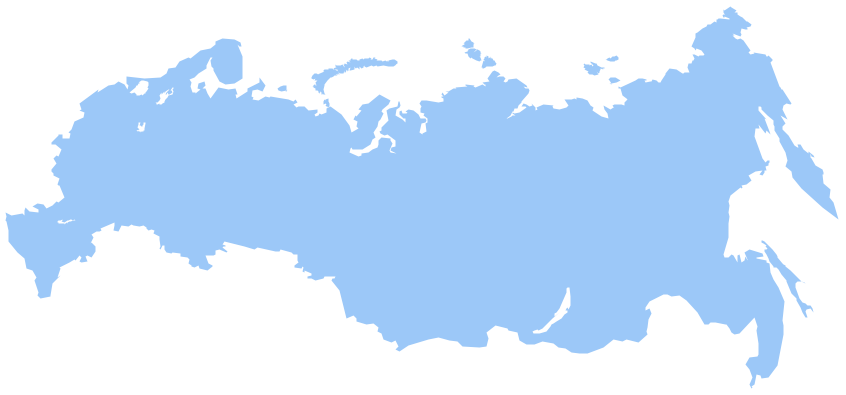
The vector stencils library Russia contains contours for ConceptDraw PRO diagramming and vector drawing software. This library is contained in the Continent Maps solution from Maps area of ConceptDraw Solution Park.Geo Map - Australia - New South Wales
The vector stencils library Australia contains contours of the Australian states and mainland territories for ConceptDraw PRO diagramming and vector drawing software.- Nature | Diagram Of The Flow Chart Of Earth Movements
- Nature | Flow Chart Of Earth Movement
- Process Flowchart | A Chàrt About The Earth Movement
- Nature | Earth Movement Flow Chart
- Digram Flow Chart Of Earth Movements
- Water cycle diagram | CERES data flow diagram | Bar Diagrams for ...
- Food security assessment - Flowchart | Weather - Vector stencils ...
- World Continents Map | Work Order Process Flowchart . Business ...
- CERES data flow diagram | Flowchart Programming Project ...
- CERES data flow diagram | Internet solutions with ConceptDraw ...
- CERES data flow diagram | Process Flowchart | How to Save a ...
- Data Flow Diagram For Online News
- Data Flow Diagram (DFD)
- CERES data flow diagram | Sun Solar System | Education ...
- Bar Chart Software | In searching of alternative to MS Visio for MAC ...
- ConceptDraw Solution Park | Data Flow Diagram Process | How to ...
- Approximate composition of the air - Pie chart | Approximate ...
- Approximate composition of the air - Pie chart | Stars and planets ...
- Approximate composition of the air - Pie chart | Percentage Pie ...
- Approximate composition of the air - Pie chart | Percentage Pie ...
