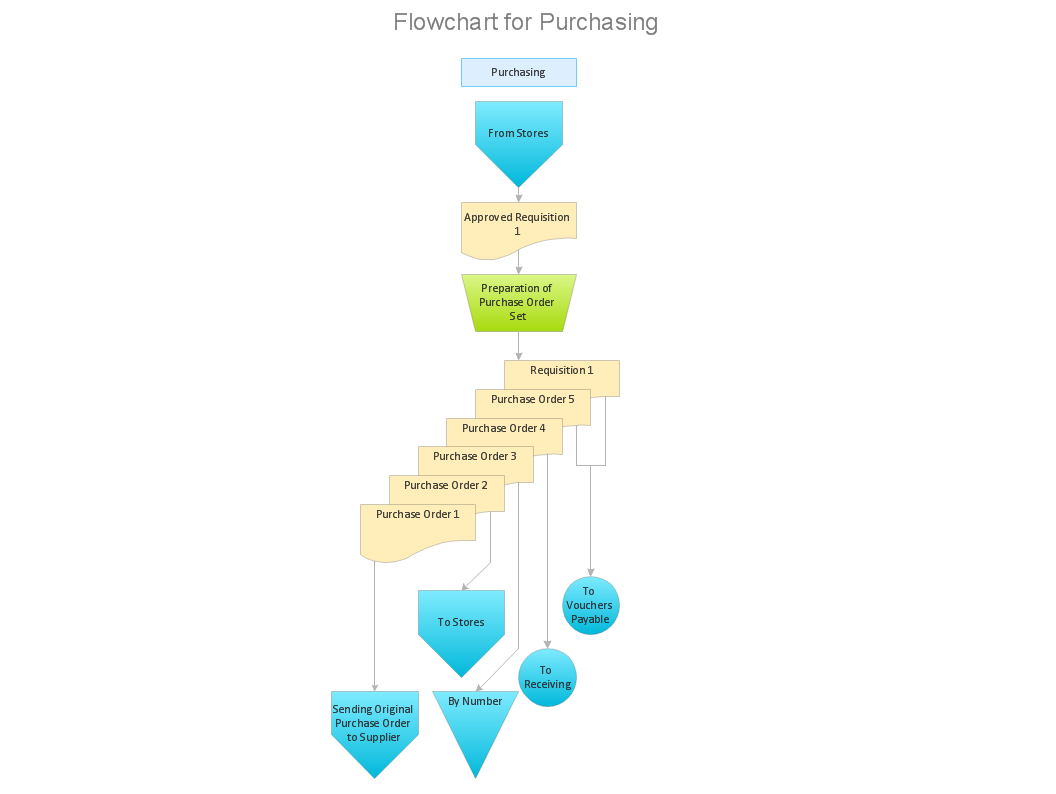
Technical Flow Chart Example

Introduction to bookkeeping: Accounting flowchart process
Process Flow Maps

Gane Sarson Diagram

Data Flow Diagram Symbols. DFD Library

Organizational Structure Total Quality Management

Create a Flow Chart
 Data Flow Diagrams (DFD)
Data Flow Diagrams solution extends ConceptDraw DIAGRAM software with templates, samples and libraries of vector stencils for drawing the data flow diagrams (DFD).
 Specification and Description Language (SDL)
For people in the field of systems engineering or system design, working with specification and description language (sdl) and finite state machines (fsm).
DFD Library System

- Draw A Flow Chart To Describe In Full Systematic Approach To
- Report Writing Simple Flow Chart
- Basic Flowchart Symbols and Meaning | Accounting Information ...
- Sales Process Flowchart . Flowchart Examples | Introduction to ...
- Agile Methodology | SSADM Diagram | Basic Flowchart Symbols ...
- Flowchart Of Fast Food
- Process Flowchart | Example of DFD for Online Store (Data Flow ...
- Process Flowchart | Basic Flowchart Symbols and Meaning ...
- Basic Flowchart Symbols and Meaning | Decision Making | Total ...
- Basic Flowchart Symbols and Meaning | Audit Flowchart Symbols ...