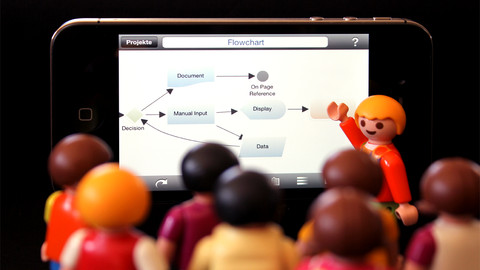
Cubetto Flowchart
Create flowcharts in a breath with Cubetto Flow on your iPad and iPhone wherever you are.
 Pie Charts
Pie Charts are extensively used in statistics and business for explaining data and work results, in mass media for comparison (i.e. to visualize the percentage for the parts of one total), and in many other fields. The Pie Charts solution for ConceptDraw PRO v10 offers powerful drawing tools, varied templates, samples, and a library of vector stencils for simple construction and design of Pie Charts, Donut Chart, and Pie Graph Worksheets.
 UK Map
The Map of UK solution contains collection of professionally designed samples and scalable vector stencil graphics maps, representing the United Kingdom counties, regions and cities. Use the Map of UK solution from ConceptDraw Solution Park as the base fo
"In elementary algebra, a quadratic equation (from the Latin quadratus for "square") is any equation having the form
ax^2+bx+c=0
where x represents an unknown, and a, b, and c are constants with a not equal to 0. If a = 0, then the equation is linear, not quadratic. The constants a, b, and c are called, respectively, the quadratic coefficient, the linear coefficient and the constant or free term.
Because the quadratic equation involves only one unknown, it is called "univariate". The quadratic equation only contains powers of x that are non-negative integers, and therefore it is a polynomial equation, and in particular it is a second degree polynomial equation since the greatest power is two.
Quadratic equations can be solved by a process known in American English as factoring and in other varieties of English as factorising, by completing the square, by using the quadratic formula, or by graphing." [Quadratic equation. Wikipedia]
The flowchart example "Solving quadratic equation algorithm" was created using the ConceptDraw PRO diagramming and vector drawing software extended with the Mathematics solution from the Science and Education area of ConceptDraw Solution Park.
 Area Charts
Area Charts are used to display the cumulative totals over time using numbers or percentages; or to show trends over time among related attributes. The Area Chart is effective when comparing two or more quantities. Each series of data is typically represented with a different color, the use of color transparency in an object’s transparency shows overlapped areas and smaller areas hidden behind larger areas.
 Language Learning
Language Learning solution extends ConceptDraw PRO software with templates, samples and library of vector stencils for drawing the sentence diagrams.
HelpDesk
Downloading the Old Versions of ConceptDraw Products
These are the last updates that were released for the previous versions of ConceptDraw products.
 Audio, Video, Media
Use it to make professional-looking documents, impressive presentations, and efficient websites with colorful and vivid illustrations and schematics of digital audio, video and photo gadgets and devices, audio video connections and configurations, S Video connection, HD and 3D television systems, home entertainment systems, Closed-circuit television (CCTV) surveillance systems. All audio video schematics, drawings and illustrations designed in ConceptDraw PRO are professional looking, clear and understandable for all thanks to applying the most commonly used standards of designations, and are effective for demonstrating in front of a small audience and on the big screens.
- Free Sentence Diagrammer | Flow Chart In English Grammar
- Free Sentence Diagrammer | Flow Charts Examples For English ...
- Flowcharts In English Grammar
- English Grammar Flowchart
- Example Of Flow Chart English Grammer
- Flow Chart English Grammer
- Flow Chart Rules
- Business Report Pie. Pie Chart Examples | Examples of Flowcharts ...
- Types of Flowcharts | Types of Flowchart - Overview | Basic ...
- Learning English By Followchart
- Use The Following Flow Chart To Write A Paragraph On How A
- Draw A Flow Chart Of Different Part Of Speech And Give Example
- Draw A Flow Chart On Parts Of Speech
- Math Topics Flow Chart Examples
- Simple Flow Chart On Alphabet Letter
- With The Help Of Flow Chart Diagram Explain Parts Of Speech
- Basic Flowchart Symbols and Meaning | Types of Flowcharts ...
- Solving quadratic equation algorithm - Flowchart | Types of ...
- English Diagram Maker
- Goods Receiving Process Flow Chart


