Process Flowchart
The main reason of using Process Flowchart or PFD is to show relations between major parts of the system. Process Flowcharts are used in process engineering and chemical industry where there is a requirement of depicting relationships between major components only and not include minor parts. Process Flowcharts for single unit or multiple units differ in their structure and implementation. ConceptDraw PRO is Professional business process mapping software for making Process flowcharts, Process flow diagram, Workflow diagram, flowcharts and technical illustrations for business documents and also comprehensive visio for mac application. Easier define and document basic work and data flows, financial, production and quality management processes to increase efficiency of your business with ConcepDraw PRO. Business process mapping software with Flowchart Maker ConceptDraw PRO includes extensive drawing tools, rich examples and templates, process flowchart symbols and shape libraries, smart connectors that allow you create the flowcharts of complex processes, process flow diagrams, procedures and information exchange. Process Flowchart Solution is project management workflow tools which is part ConceptDraw Project marketing project management software. Drawing charts, diagrams, and network layouts has long been the monopoly of Microsoft Visio, making Mac users to struggle when needing such visio alternative like visio for mac, it requires only to view features, make a minor edit to, or print a diagram or chart. Thankfully to MS Visio alternative like ConceptDraw PRO software, this is cross-platform charting and business process management tool, now visio alternative for making sort of visio diagram is not a problem anymore however many people still name it business process visio tools.
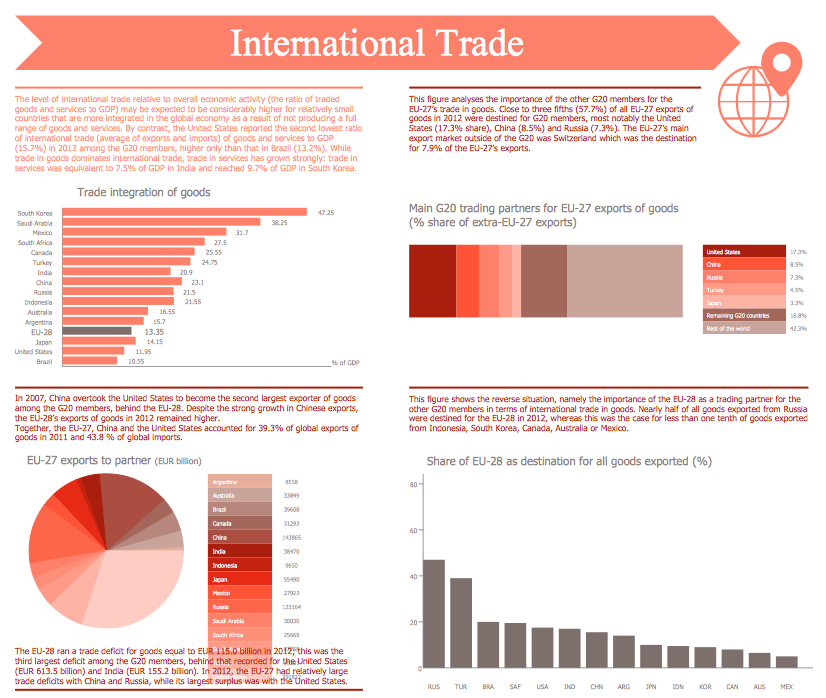
Sales Growth. Bar Graphs Example
This sample was created in ConceptDraw PRO diagramming and vector drawing software using the Bar Graphs Solution from Graphs and Charts area of ConceptDraw Solution Park. It is Bar Graphs example, Sales Growth example, Column Chart Example - Sales Report.HelpDesk
How to Create the Custom Diagram Template on Mac
ConceptDraw?PRO enables you to?place your own templates. You can create diagram with ConceptDraw PRO using your custom Template. You can set up your Template as a default ConceptDraw PRO start page. A template diagram is a drawing that serves as a starting point for a new graphic document. When you open a template, it is pre-formatted in some way. For example, you might use template that is formatted as an organizational chart. The template would likely have a workspace and a corresponding object libraries. When you save a file created with a template, you are usually prompted to save a copy of the file, so that you don't save over the template. Templates can either come with a proper solution or can be created by the user. If you find yourself creating similar documents over and over again, it might be a good idea to save one of them as a template. Then you won't have to format your documents each time you want to make a new one. Just open the template and start from there.Bar Diagram Math
ConceptDraw PRO extended with Divided Bar Diagrams solution from Graphs and Charts area of ConceptDraw Solution Park is the best software for quick and simple drawing the Divided Bar Diagrams and Bar Diagram Math.How To Create Project Report
ConceptDraw PROJECT contains an extensive tool set to help project managers. The rich data visualization capability that is provided by ConceptDraw products helps you create project dashboards, one-click reports, multi-project views, Gantt charts, and resource views. Let′s learn how to get maximum value using ConceptDraw PROJECT!Banquet Hall Plan Software
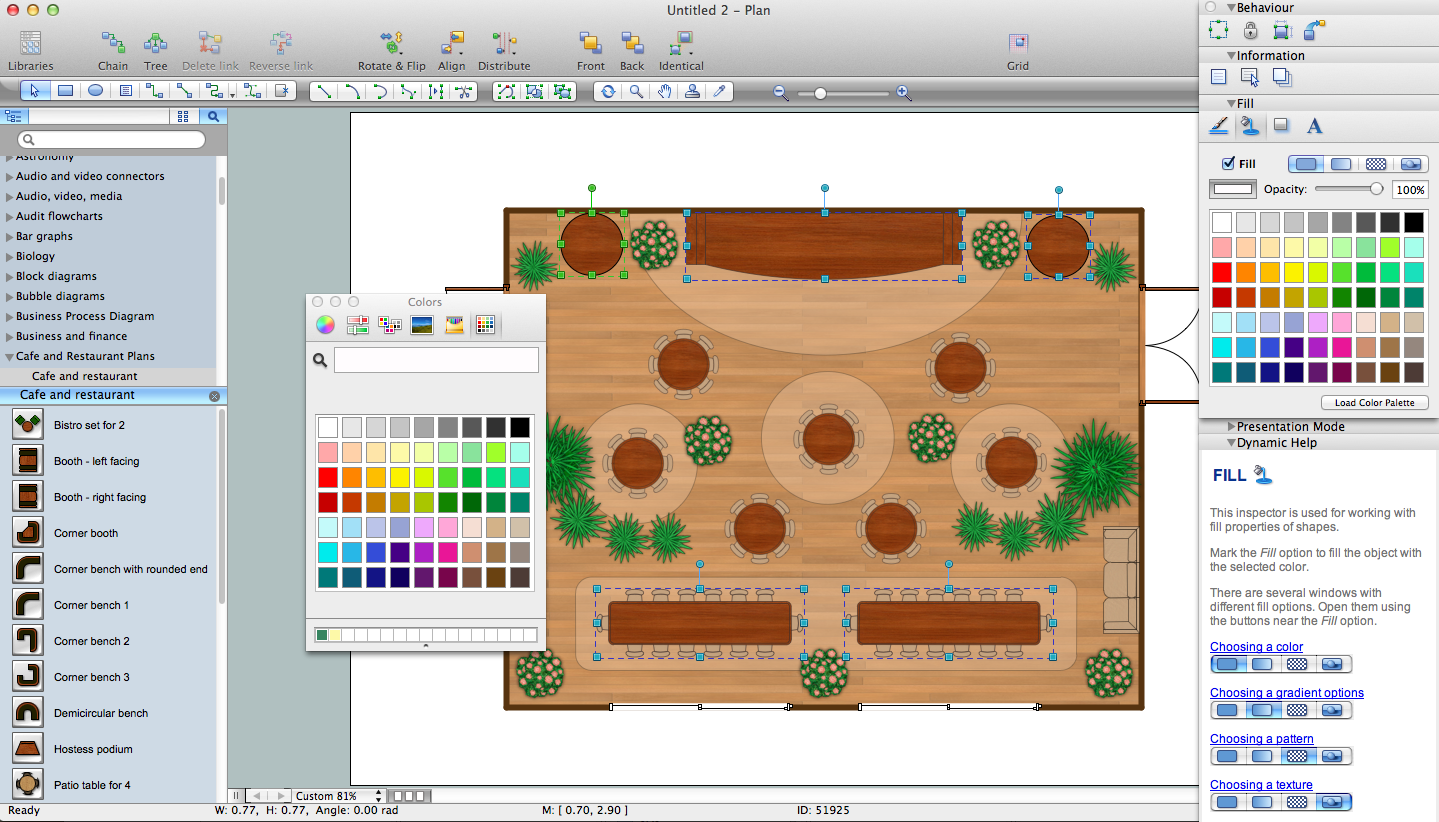
Our life is filled with a huge number of lucky events. Many of them are the reasons for organizing the celebration, feast, party or banquet. These events include of course weddings, birthdays, meetings with friends, themed parties, corporate events, and others. The main component of successful organization and banquet holding is its correct planning considering of all nuances and specifics of given event. You need compose the list of guests, determine a budget, select a suitable location for organizing event, determine its format - a traditional reception or buffet, consider menu and interesting entertainment program. A correct selection of banquet hall is one of the most important component of success. All details are important - location, reviews, hall size, interior, design, lighting, landscape design of surrounding territory. ConceptDraw PRO software extended with Cafe and Restaurant Floor Plan solution from Building Plans Area will help you ideally plan your banquet, create the plan of banquet hall and guests seating chart, and even design and construct new banquet hall.What is a KPI?
What is a KPI? Key performance indicators (KPIs) represent a set of measures that are focused on the aspects of organizational performance which are the most important for its current and future success. ConceptDraw PRO diagramming and vector drawing software enhanced with Sales Dashboard solution from the Marketing area of ConceptDraw Solution Park allows effectively develop, analyze and improve your business thanks to the excellent possibility of monitoring all KPIs on one screen in a real time.- Flowchart Diagram For Revenue Process
- Revenue Process Flowchart
- Process Flow Chart Of Revenue From Softaware
- Flow chart Example. Warehouse Flowchart | Telecommunication ...
- How to Create Flowcharts for an Accounting Information System ...
- Sales Process Flowchart . Flowchart Examples | How to Create a ...
- What is Interactive Flowcharts | Create Response Charts | Social ...
- What is Interactive Flowcharts | How to Create a Social Media DFD ...
- Workflow Diagram Template | Fishbone Diagram Template ...
- UML Flowchart Symbols | Money - Design Elements | Work Order ...
- Business Process Diagrams | Process Flowchart | Basic Flowchart ...
- What is Interactive Flowcharts | Flowchart Program Mac | Create ...
- Sales Process Flowchart . Flowchart Examples | How to Create a ...
- Create Response Charts | Activity Network (PERT) Chart | PM ...
- SWOT Analysis Solution - Strategy Tools | Flowchart Software ...
- Blank Flow Charts
- Sales Growth. Bar Graphs Example | Bar Chart Examples | Create ...
- Sales Growth. Bar Graphs Example | Bar Chart Examples | Bar ...
- Sale process | Root cause
- Double bar graph - Template | Bar Graphs | Nitrate concentration in ...


