Cross-Functional Flowcharts in ConceptDraw
Use ConceptDraw PRO enhanced with solutions from ConceptDraw Solution Park to create diagrams to present and explain structures, process flows, logical relationships and networks.
 Fishbone Diagrams
The Fishbone Diagrams solution extends ConceptDraw PRO v10 software with the ability to easily draw the Fishbone Diagrams (Ishikawa Diagrams) to clearly see the cause and effect analysis and also problem solving. The vector graphic diagrams produced using this solution can be used in whitepapers, presentations, datasheets, posters, and published technical material.
"A project management process is the management process of planning and controlling the performance or execution of a project. ...
Inputs:
(1) Documented need to act.
(2) Project plan templates.
(3) Lessons learned from previous projects.
(4) Existing project management standards.
(5) External information.
(6) Resources for project planning and project execution.
Process:
(1) Project initiation.
(2) Project planning.
(3) Project execution.
(4) Project control and validation.
(5) Project closeout.
Outputs:
(1) Project products delivered.
(2) Project objectives achieved (as a result of the interplay among project products and the organization or its environment).
(3) Lessons learned documented." [Project management process. Wikipedia]
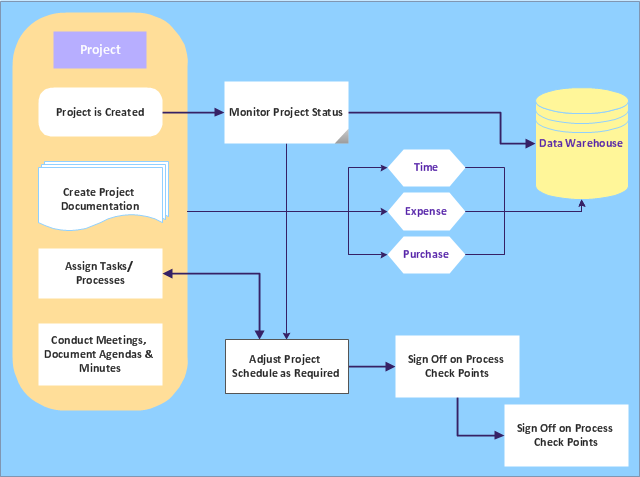
The audit flowchart example "Project management process" was created using the ConceptDraw PRO diagramming and vector drawing software extended with the Audit Flowcharts solution from the Finance and Accounting area of ConceptDraw Solution Park.
www.conceptdraw.com/ solution-park/ finance-audit-flowcharts
- Flow Chart Of Environmental Audit
- Audit Flowcharts | Basic Audit Flowchart . Flowchart Examples | Audit ...
- Flow Diagram Of Environmental Audit
- Basic Audit Flowchart . Flowchart Examples | Types of Flowchart ...
- Environmental Auditing Flow Chart
- Basic Audit Flowchart . Flowchart Examples | Audit Flowcharts | Linux ...
- Flowchart Of Environmental Auditing
- Types of Flowcharts | Diagrammatic Environmental Audit Methodology
- Accounting Flowchart Symbols | Azure Architecture | Environment ...
- Draw A Schematic Diagram Of An Environmental Audit
- HR Flowchart Symbols | Flowcharts | Business Process Mapping ...
- Basic Audit Flowchart . Flowchart Examples | Simple Drawing ...
- Material Requisition Flowchart . Flowchart Examples | Business ...
- What Are The Procedures Or The Flow Chart Of The Basic Steps In ...
- Process Flowchart | Internal Audit Process | Auditing Process. Audit ...
- Basic Flowchart Symbols and Meaning | Process Flowchart | Flow ...
- Basic Audit Flowchart . Flowchart Examples | UML Diagram | Fully ...
- Event-driven Process Chain Diagrams | Audit Process Flowchart ...
- Basic Flowchart Symbols and Meaning | Audit Flowchart Symbols ...
- SWOT Analysis | Draw Flow Chart On Enviroment

