This is a schematic process flow diagram of the processes used in a typical oil refinery.
This process flow diagram (PFD) example was redesigned from the Wikimedia Commons file: RefineryFlow.png. [commons.wikimedia.org/ wiki/ File:RefineryFlow.png]
This file is licensed under the Creative Commons Attribution-Share Alike 3.0 Unported license. [creativecommons.org/ licenses/ by-sa/ 3.0/ deed.en]
"An oil refinery or petroleum refinery is an industrial process plant where crude oil is processed and refined into more useful products such as petroleum naphtha, gasoline, diesel fuel, asphalt base, heating oil, kerosene and liquefied petroleum gas. Oil refineries are typically large, sprawling industrial complexes with extensive piping running throughout, carrying streams of fluids between large chemical processing units. In many ways, oil refineries use much of the technology of, and can be thought of, as types of chemical plants. The crude oil feedstock has typically been processed by an oil production plant. There is usually an oil depot (tank farm) at or near an oil refinery for the storage of incoming crude oil feedstock as well as bulk liquid products.
An oil refinery is considered an essential part of the downstream side of the petroleum industry." [Oil refinery. Wikipedia]
The PFD example "Process flow diagram - Typical oil refinery" was created using the ConceptDraw PRO diagramming and vector drawing software extended with the Chemical and Process Engineering solution from the Chemical and Process Engineering area of ConceptDraw Solution Park.
Process Flow Diagram (PFD)
-process-flow-diagram---typical-oil-refinery.png--diagram-flowchart-example.png)
HelpDesk
How to Draw a Chemical Process Flow Diagram

 Chemical and Process Engineering
This chemical engineering solution extends ConceptDraw PRO v.9.5 (or later) with process flow diagram symbols, samples, process diagrams templates and libraries of design elements for creating process and instrumentation diagrams, block flow diagrams (BFD
 Fishbone Diagrams
The Fishbone Diagrams solution extends ConceptDraw PRO v10 software with the ability to easily draw the Fishbone Diagrams (Ishikawa Diagrams) to clearly see the cause and effect analysis and also problem solving. The vector graphic diagrams produced using this solution can be used in whitepapers, presentations, datasheets, posters, and published technical material.
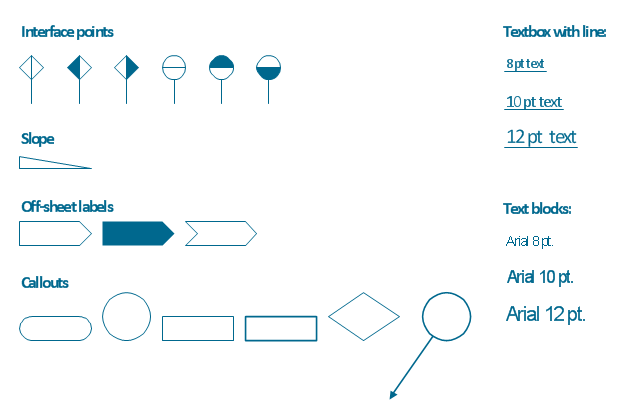
The vector stencils library "Process annotations" contains 22 symbols of interface points, slope, off-sheet labels, callouts and textboxes.
Use these shapes for setting automatic labels to display a datasheet field for a pipeline shape, labels, captions, outlines, off-sheet labels, text balloons, annotations, outlines, tags, and descriptions.
"In engineering a process is a set of interrelated tasks that, together, transform inputs into outputs. These tasks may be carried out by people, nature, or machines using resources; so an engineering process must be considered in the context of the agents carrying out the tasks, and the resource attributes involved. Systems Engineering normative documents and those related to Maturity Models are typically based on processes. For example, System Engineering processes of the EIA-632 and processes involved in the Capability Maturity Model Integration (CMMI) institutionalization and improvement approach. Constraints imposed on the tasks and resources required to implement them are essential for executing the tasks mentioned.
A chemical process is a series of unit operations used to produce a material in large quantities.
In the chemical industry, chemical engineers will use the following to define or illustrate a process:
Process Flow Diagram (PFD),
Piping and instrumentation diagram
(P&ID),
Simplified process description,
Detailed process description,
Project management,
Process simulation." [Process (engineering). Wikipedia]
The example "Design elements - Process annotations" was created using the ConceptDraw PRO diagramming and vector drawing software extended with the Chemical and Process Engineering solution from the Engineering area of ConceptDraw Solution Park.
Process annotation symbols
"An invoice, bill or tab is a commercial document issued by a seller to a buyer, relating to a sale transaction and indicating the products, quantities, and agreed prices for products or services the seller has provided the buyer.
Payment terms are usually stated on the invoice. These may specify that the buyer has a maximum number of days in which to pay, and is sometimes offered a discount if paid before the due date. The buyer could have already paid for the products or services listed on the invoice.
In the rental industry, an invoice must include a specific reference to the duration of the time being billed, so in addition to quantity, price and discount the invoicing amount is also based on duration. Generally each line of a rental invoice will refer to the actual hours, days, weeks, months, etc., being billed.
From the point of view of a seller, an invoice is a sales invoice. From the point of view of a buyer, an invoice is a purchase invoice. The document indicates the buyer and seller, but the term invoice indicates money is owed or owing. ...
Payment of invoices.
Organizations purchasing goods and services usually have a process in place for approving payment of invoices based on an employee's confirmation that the goods or services have been received.
Typically, when paying an invoice, a remittance advice will be sent to the supplier to inform them their invoice has been paid." [Invoice. Wikipedia]
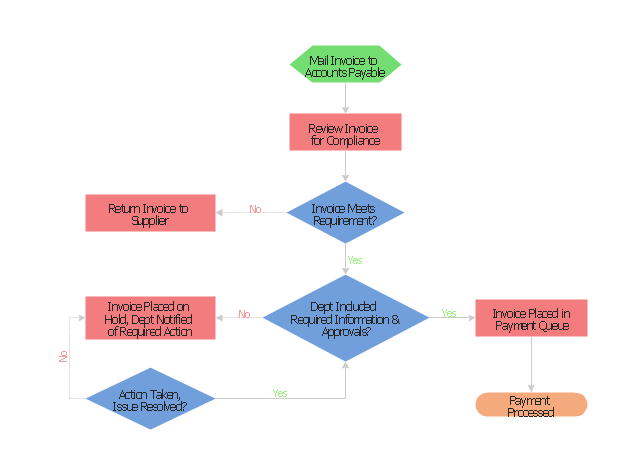
The flow chart example "Invoice payment process" was created using the ConceptDraw PRO diagramming and vector drawing software extended with the Flowcharts solution from the area "What is a Diagram" of ConceptDraw Solution Park.
Payment terms are usually stated on the invoice. These may specify that the buyer has a maximum number of days in which to pay, and is sometimes offered a discount if paid before the due date. The buyer could have already paid for the products or services listed on the invoice.
In the rental industry, an invoice must include a specific reference to the duration of the time being billed, so in addition to quantity, price and discount the invoicing amount is also based on duration. Generally each line of a rental invoice will refer to the actual hours, days, weeks, months, etc., being billed.
From the point of view of a seller, an invoice is a sales invoice. From the point of view of a buyer, an invoice is a purchase invoice. The document indicates the buyer and seller, but the term invoice indicates money is owed or owing. ...
Payment of invoices.
Organizations purchasing goods and services usually have a process in place for approving payment of invoices based on an employee's confirmation that the goods or services have been received.
Typically, when paying an invoice, a remittance advice will be sent to the supplier to inform them their invoice has been paid." [Invoice. Wikipedia]
The flow chart example "Invoice payment process" was created using the ConceptDraw PRO diagramming and vector drawing software extended with the Flowcharts solution from the area "What is a Diagram" of ConceptDraw Solution Park.
Flowchart - Invoice payment process
"A piping and instrumentation diagram/ drawing (P&ID) is a diagram in the process industry which shows the piping of the process flow together with the installed equipment and instrumentation. ...
P&IDs play a significant role in the maintenance and modification of the process that it describes. It is critical to demonstrate the physical sequence of equipment and systems, as well as how these systems connect. During the design stage, the diagram also provides the basis for the development of system control schemes, allowing for further safety and operational investigations, such as a Hazard Analysis and Operability Study...
For processing facilities, it is a pictorial representation of:
Key piping and instrument details,
Control and shutdown schemes,
Safety and regulatory requirements,
Basic start up and operational information." [Piping and instrumentation diagram. Wikipedia]
The piping and instrumentation diagram template for the ConceptDraw PRO diagramming and vector drawing software is included in the Chemical and Process Engineering solution from the Engineering area of ConceptDraw Solution Park.
Piping and instrumentation diagram / drawing (P&ID)
-piping-and-instrumentation-diagram-template.png--diagram-flowchart-example.png)
- Flowsheet Chemical Industry Com
- What Is A Terminal Flow Sheet In The Petroleum Industry
- Pdf Types Of Flow Sheet In Chemical Industrial
- Types Of Flow Sheet In Chemical Engineering
- General Equipment Flow Sheet For Pharmaceutical Industry Used
- Importance Of Process Flow Sheet In Chemical Industries With
- How to Draw a Chemical Process Flow Diagram
- Chemical Industries Flow Chart
- Pharmaceutical Industry All Work Flow Chart
- Process Flow Diagram Symbols | Chemical and Process ...
- Petrochemical Industry Wih Help Of Process Flow Diagram
- Process Flowchart | Flow Sheet Industry App In Pc
- Raw Material Flow Sheet In Chemical Industry
- Process Engineering | Process Flow Diagram Symbols | Process ...
- Process Flow Diagram | Terminal Flow Sheet In Oil And Gas Industry
- Flow Chart Diagram In Chemical Industry Pdf
- Process Flow Diagram Symbols | Process Engineering | Process ...
- Industrial Process Unit Operation Flow Chart
- Role Of Industrial Relations System Flow Chart
- Process flow diagram - Typical oil refinery | Crude oil distillation unit ...