This site uses cookies. By continuing to browse the ConceptDraw site you are agreeing to our Use of Site Cookies.

Business Process Flowchart Symbols

Business process modeling is known in the corporate world as an excellent tool which can speak. Business process flowcharts, diagrams and maps are used to define the business processes in terms of inputs and outputs, to visually represent and effectively explain complex business processes of an enterprise, and also showcase decisions on a single piece of paper. The process of business process mapping supposes the use of special business process flowchart symbols predefined by Business Process Modeling Notation (BPMN) and taking their roots from the data processing diagrams and programming flow charts. In other words the BPMN standard notation is a common language used for business process design and implementation, that guarantees a clarity of designed Business Process Flowcharts for all business analysts, technical developers and business managers. The ability to create professionally-looking Business Process flowcharts, maps and diagrams, is provided by powerful ConceptDraw DIAGRAM software and the Business Process Mapping solution included to ConceptDraw Solution Park.

Basic of Flowchart: Meaning and Symbols

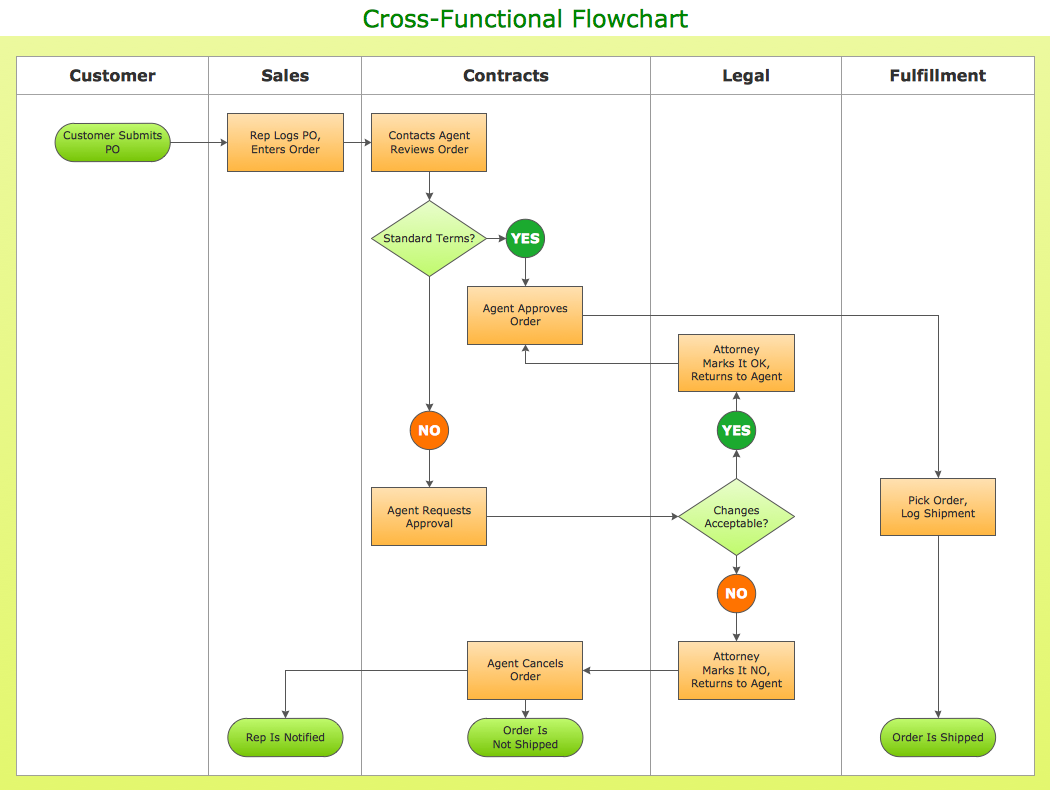
Flowcharts are the best for visually representation the business processes and the flow of a custom-order process through various departments within an organization. ConceptDraw DIAGRAM diagramming and vector drawing software extended with Flowcharts solution offers the full set of predesigned basic flowchart symbols which are gathered at two libraries: Flowchart and Flowcharts Rapid Draw. Among them are: process, terminator, decision, data, document, display, manual loop, and many other specific symbols. The meaning for each symbol offered by ConceptDraw gives the presentation about their proposed use in professional Flowcharts for business and technical processes, software algorithms, well-developed structures of web sites, Workflow diagrams, Process flow diagram and correlation in developing on-line instructional projects or business process system. Use of ready flow chart symbols in diagrams is incredibly useful — you need simply drag desired from the libraries to your document and arrange them in required order. There are a few serious alternatives to Visio for Mac, one of them is ConceptDraw DIAGRAM. It is one of the main contender with the most similar features and capabilities.
How to Build a Flowchart

Electrical Symbols — Composite Assemblies

Electronic components have two or more electrical terminals (or leads) aside from antennas which may only have one terminal. These leads connect to create an electronic circuit with a particular function (for example an amplifier, radio receiver, or oscillator). Basic electronic components may be packaged discretely, as arrays or networks of like components, or integrated inside of packages such as semiconductor integrated circuits, hybrid integrated circuits, or thick film devices. 26 libraries of the Electrical Engineering Solution of ConceptDraw DIAGRAM make your electrical diagramming simple, efficient, and effective. You can simply and quickly drop the ready-to-use objects from libraries into your document to create the electrical diagram.

Technical Flow Chart Example

What illustrates a technical flow chart? Technical flow chart is a diagrammatic representation which visually illustrates the sequence of operations that must to be performed to get the problem's solution. ConceptDraw DIAGRAM enhanced with Flowcharts Solution from the "Diagrams" Area of ConceptDraw Solution is a perfect software for drawing Technical Flow Chart Example illustrating the essence and importance of the technical flow chart use.
The vector stencils library "TQM diagrams" contains 58 TQM symbols. Use it in business process re-engineering, total quality management, continuous improvement, and quality solutions to draw cause-and-effect diagrams, top-down, and cross-functional process flow charts in the ConceptDraw PRO diagramming and vector drawing software extended with the Total Quality Management (TQM) Diagrams solution from the Quality area of ConceptDraw Solution Park.
Transportation
Transportation, transportation,
Inbound Goods
Inbound Goods, inbound goods,
Storage
Storage, storage,
Procedure
Procedure, procedure,
Operation
Operation, operation,
Operation/ Inspection
Operation/ Inspection, operation, inspection,
Issue
Issue, issue,
Organization Function
Organization Function, organization function,
2-Part Function
2-Part Function, 2-part function, two-part function,
Decision 1 (TQM)
Decision 1 (TQM), decision,
Decision 2 (TQM)
Decision 2 (TQM), decision,
Multi in/out Decision (Multi-Input on right)
Multi in/out Decision (Multi-Input on right), multi in/out decision, multi-input,
Multi in/out Decision (Multi-Input on left)
Multi in/out Decision (Multi-Input on left), multi in/out decision, multi-input,
External Organization
External Organization, external organization,
External Process
External Process, external process,
Inspection/Measurement
Inspection/Measurement, inspection, measurement,
Metric
Metric, metric,
2-part metric
2-part metric, 2-part metric, two-part metric,
System Database
System Database, system database,
System Support
System Support, system support,
System Function
System Function, system function,
Delay
Delay, delay,
Connector (TQM)
Connector (TQM), connector,
Off-Page Reference
Off-Page Reference, off-page reference,
Connected Issues
Connected Issues, connected issues,
Fabrication (black)
Fabrication (black), fabrication,
Fabrication (white)
Fabrication (white), fabrication,
Move (black)
Move (black), move,
Move (white)
Move (white), move,
Store (black)
Store (black), store, storage,
Store (white)
Store (white), store, storage,
Inspection (black)
Inspection (black), inspection,
Inspection (white)
Inspection (white), inspection,
Selectable Process (All White)
Selectable Process (All White), selectable process,
Selectable Process ('Fabrication' Black)
Selectable Process ('Fabrication' Black), selectable process, fabrication,
Selectable Process ('Move' Black)
Selectable Process ('Move' Black), selectable process, move,
Selectable Process ('Store' Black)
Selectable Process ('Store' Black), selectable process, store,
Selectable Process ('Inspection' Black)
Selectable Process ('Inspection' Black), selectable process, inspection,
Work Flow Loop 1
Work Flow Loop 1, work flow loop,
Work Flow Loop 2
Work Flow Loop 2, work flow loop,
Feedback Arrow
Feedback Arrow, feedback arrow,
X-Function - Vertical
X-Function - Vertical, X-function,
X-Function - Horizontal
X-Function - Horizontal, X-function,
Force-Field Analysis
Force-Field Analysis, force-field analysis,
Cause 1
Cause 1, cause,
Cause 2
Cause 2, cause,
Cause 3
Cause 3, cause,
Category
Category, category,
Effect
Effect, effect,
Fish Frame
Fish Frame, fish frame, cause-and-effect, fishbone,
Dynamic Connector
Dynamic Connector,
Result
Result, result,
No Result
No Result, no result,
Branch: Return
Branch: Return,
Branch: No Return
Branch: No Return,
Interrupt
Interrupt, interrupt,
External Control
External Control, external control,
Refinement
Refinement, refinement,

Create your own flow charts of data processing systems using the ConceptDraw DIAGRAM diagramming and vector drawing software extended with the Cross-Functional Flowcharts solution from the Business Processes area of ConceptDraw Solution Park. This is a flowchart of a data processing system combining manual and computerized processing to handle accounts receivable, billing, and general ledger.

Fault Tree Analysis Software

ConceptDraw DIAGRAM extended with Fault Tree Analysis Diagrams Solution from the Industrial Engineering Area of ConceptDraw Solution Park is the best Fault Tree Analysis Software. First of all, Fault Tree Analysis Diagrams Solution provides a set of samples which are the good examples of easy drawing professional looking Fault Tree Analysis Diagrams.
The vector stencils library "Flowchart" contains 26 symbols for drawing flowcharts.
Use these shapes to draw your flow charts in the ConceptDraw PRO diagramming and vector drawing software extended with the Flowcharts solution from the area "What is a Diagram" of ConceptDraw Solution Park.
www.conceptdraw.com/ solution-park/ diagram-flowcharts
Terminator
Terminator, terminator, start, end,
Process
Process, process, action,
Decision
Decision, decision,
Delay
Delay, delay,
Subroutine
Subroutine, subroutine, predefined process,
Data
Data, data, input, output,
Document
Document, document,
Multiple documents
Multiple documents, multiple documents,
Preparation
Preparation, preparation,
Display
Display, display,
Manual input
Manual input, manual input,
Manual loop
Manual loop, manual loop,
Loop limit
Loop limit, loop limit,
Connector
Connector, connector,
Off-page connector
Off-page connector, off page,
Off-page connector
Off-page connector, off page,
Off-page connector
Off-page connector, off page,
Off-page connector
Off-page connector, off page,
Or
Or, or,
Summing junction
Summing junction, summing junction, summing,
Collate
Collate, collate,
Sort
Sort, sort,
Merge
Merge, merge, store,
Stored data
Stored data, stored data, data storage,
Database
Database, database, disk,
Internal storage
Internal storage, internal storage,

Process Flow app for macOS

Use ConceptDraw DIAGRAM diagramming and business graphics software to draw your own flowcharts of computer algorithms.
The vector stencils library "Flowchart" contains 26 symbols for drawing flowcharts.
Use these shapes to draw your flow charts in the ConceptDraw PRO diagramming and vector drawing software extended with the Flowcharts solution from the area "What is a Diagram" of ConceptDraw Solution Park.
www.conceptdraw.com/ solution-park/ diagram-flowcharts
Terminator
Terminator, terminator, start, end,
Process
Process, process, action,
Decision
Decision, decision,
Delay
Delay, delay,
Subroutine
Subroutine, subroutine, predefined process,
Data
Data, data, input, output,
Document
Document, document,
Multiple documents
Multiple documents, multiple documents,
Preparation
Preparation, preparation,
Display
Display, display,
Manual input
Manual input, manual input,
Manual loop
Manual loop, manual loop,
Loop limit
Loop limit, loop limit,
Connector
Connector, connector,
Off-page connector
Off-page connector, off page,
Off-page connector
Off-page connector, off page,
Off-page connector
Off-page connector, off page,
Off-page connector
Off-page connector, off page,
Or
Or, or,
Summing junction
Summing junction, summing junction, summing,
Collate
Collate, collate,
Sort
Sort, sort,
Merge
Merge, merge, store,
Stored data
Stored data, stored data, data storage,
Database
Database, database, disk,
Internal storage
Internal storage, internal storage,

Functional Flow Block Diagram

You need to draw a Functional Flow Block Diagram? You are an artist? Now it doesn't matter. With Block Diagrams solution from the "Diagrams" area for ConceptDraw Solution Park you don't need more to be an artist to design the Functional Flow Block Diagram of any complexity.

How to Draw a Flowchart

A good Flowchart is incredibly helpful for representing and understanding the system and systematic flow of information in the system. That's why its creation requires attention, accuracy, caution and expertise. There are many standardized symbols which can be used in Flowcharts to represent different kinds of steps. The basic flowchart's element is a simple action, which is represented as a box containing description of the action. The flow is shown with arrows between sequential action boxes. The decision is shown as a diamond that contains a simple question to which the answer is 'yes' or 'no' Are you confused on how to draw a Flowchart? ConceptDraw DIAGRAM diagramming and vector drawing software will help you in flowchart drawing due to the included templates, samples and vector objects libraries which are offered in great quantity by Flowcharts solution from Diagrams area. Besides you need clearly and accurately define the process boundaries with starting and ending points, and each step in the process, identify time lags and non-value-adding steps.

Create Process Flowcharts

A process flowchart is a picture of the separate steps of a process in sequential order.Use ConceptDraw DIAGRAM software and the vector stencils from object libraries are designed objects you can use adding to process flowcharts for the best result.

Business Process Reengineering. Business Process Example

This sample shows the Business Process Reengineering Diagram, displays the Continuous Improvement Process (CIP) directed at the permanent improvement of the processes. This sample can be used in business process management, quality management, project management and program management.
The vector stencils library "Flowchart" contains 26 symbols for drawing flowcharts.
Use these shapes to draw your flow charts in the ConceptDraw PRO diagramming and vector drawing software extended with the Flowcharts solution from the area "What is a Diagram" of ConceptDraw Solution Park.
www.conceptdraw.com/ solution-park/ diagram-flowcharts
Terminator
Terminator, terminator, start, end,
Process
Process, process, action,
Decision
Decision, decision,
Delay
Delay, delay,
Subroutine
Subroutine, subroutine, predefined process,
Data
Data, data, input, output,
Document
Document, document,
Multiple documents
Multiple documents, multiple documents,
Preparation
Preparation, preparation,
Display
Display, display,
Manual input
Manual input, manual input,
Manual loop
Manual loop, manual loop,
Loop limit
Loop limit, loop limit,
Connector
Connector, connector,
Off-page connector
Off-page connector, off page,
Off-page connector
Off-page connector, off page,
Off-page connector
Off-page connector, off page,
Off-page connector
Off-page connector, off page,
Or
Or, or,
Summing junction
Summing junction, summing junction, summing,
Collate
Collate, collate,
Sort
Sort, sort,
Merge
Merge, merge, store,
Stored data
Stored data, stored data, data storage,
Database
Database, database, disk,
Internal storage
Internal storage, internal storage,

Types of Flowcharts

A Flowchart is a graphical representation of process, algorithm, workflow or step-by-step solution of the problem. It shows the steps as boxes of various kinds and connects them by arrows in a defined order depicting a flow. There are twelve main Flowchart types: Basic Flowchart, Business Process Modeling Diagram (BPMN), Cross Functional Flowchart, Data Flow Diagram (DFD), IDEF (Integrated DEFinition) Flowchart, Event-driven Process Chain (EPC) Diagram, Influence Diagram (ID), Swimlane Flowchart, Process Flow Diagram (PFD), Specification and Description Language (SDL) Diagram, Value Stream Mapping, Workflow Diagram. Using the Flowcharts solution from the Diagrams area of ConceptDraw Solution Park you can easy and quickly design a Flowchart of any of these types. This solution offers a lot of special predesigned vector symbols for each of these widely used notations. They will make the drawing process of Flowcharts much easier than ever. Pay also attention for the included collection of ready Flowchart examples, samples and quick-start templates. This is business process improvement tools. If you are looking for MS Visio for your Mac, then you are out of luck, because it hasn't been released yet. However, you can use Visio alternatives that can successfully replace its functions. ConceptDraw DIAGRAM is an alternative to MS Visio for Mac that provides powerful features and intuitive user interface for the same.
How to Simplify Flow Charting

Technical Flow Chart

Flow chart is a diagrammatic representation of an algorithm and essential part of planning the system. Flow charts are widely used in technical analysis and programming for easy writing programs and explaining them to others. So, one of the most popular type of flow charts is Technical Flow Chart. Technical Flow Chart can be drawn by pencil on the paper, but it will be easier to use for designing a special software. ConceptDraw DIAGRAM diagramming and vector drawing software extended with Flowcharts Solution from the "Diagrams" Area of ConceptDraw Solution Park will be useful for this goal.

Components of ER Diagram

Entity-Relationship model gives the possibility to visually describe a database using the components of ER Diagram, entity relationship stencils, relationship symbols, work flow shapes. ER-diagram lets represent the data or entities, attributes of these entities and relationships between them, using standardized Crow’s Foot notation icons or Chen’s notation icons. An entity is an object of the real world, it can exist independently and has the instances which differ in attribute values (properties). The attributes give an unambiguous (uniquely) identification for the instance and are called the primary key, this key can be composite and combine several attributes. ConceptDraw DIAGRAM is a professional software available with Entity-Relationship Diagram (ERD) solution from Software Development area that lets create ERDs for various database systems, using Crow’s Foot and Chen’s notations. It is invaluable tool for software engineers and developers, it supports ODBC-compatible databases (Oracle, MySQL, MS Access, MS SQL, InterBase, Firebird and others).

How to Prepare Learning Presentations for Training

Interactive tool helps you find the appropriate response to social media mentions quickly.

Diagramming software for Amazon Web Service diagrams, charts and schemes

Professional software: visualize general system architecture, AWS diagrams are part of architecturing tools provided with ConceptDraw Solution Park.