This site uses cookies. By continuing to browse the ConceptDraw site you are agreeing to our Use of Site Cookies.

Flowchart Marketing Process. Flowchart Examples

This sample shows the Flowchart that displays the layout and work flow of the cloud marketing platform. This diagram has a style of the marketing brochure. This style displays the central product that is related to the other issues. Using the ready-to-use predesigned objects, samples and templates from the Flowcharts Solution for ConceptDraw DIAGRAM you can create your own professional looking Flowchart Diagrams quick and easy.

How to Dramatically Reduce Drawing Time - New connection modes

The innovative ConceptDraw Arrows10 Technology included in ConceptDraw DIAGRAM is a powerful drawing tool that changes the way diagrams are produced. While making the drawing process easier and faster. This is more than enough versatility to draw any type of diagram with any degree of complexity.

Quality Control Chart Software — ISO Flowcharting

Quality Control Chart Software (ISO Flowcharting) - ConceptDraw DIAGRAM extended with Total Quality Management TQM Diagrams Solution from the Quality Management Area is the best diagramming and vector drawing software that allows you to draw the quality control charts quick and easy. The quality control chart is a graphic that illustrates the accordance of processes or products to the intended specifications and degree of differences from them. Depending on what type of data you need analyze, there are used different types of quality control charts: X-bar charts, S charts, Np charts.

Diagramming Software for Design UML Timing Diagrams

UML Timing Diagram as special form of a sequence diagram are used to explore the behaviors of objects throughout a given period of time.

State Machine Diagram

UML state machine's goal is to overcome the main limitations of traditional finite-state machines while retaining their main benefits. ConceptDraw is ideal for software designers and software developers who need to draw UML State Machine Diagrams.

Banking System

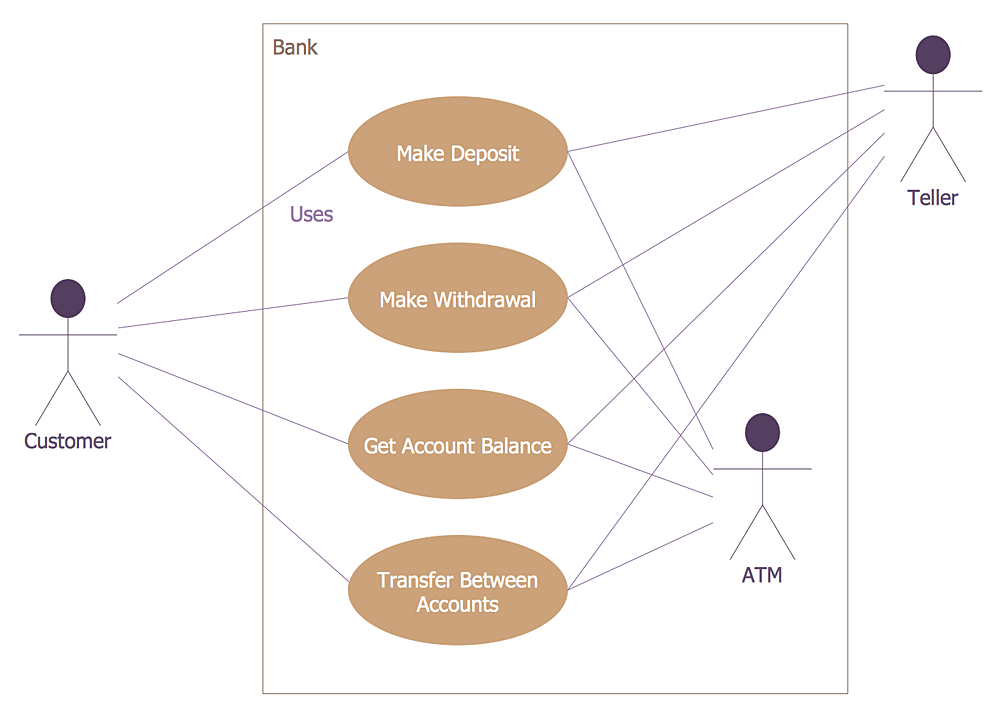
ConceptDraw DIAGRAM extended with ATM UML Diagrams Solution from the Software Development Area of ConceptDraw Solution Park is a powerful software for representing the ATM processes, for designing and building banking system and ATMs.

Example of Organizational Chart

Example of Organizational Chart - Lots of organization chart examples created by ConceptDraw Organizational Chart Software. Include company organizational chart, hospital organizational chart, hotel Organizational chart, corporate organizational chart samples etc
How to draw an Organizational Chart

UML Use Case Diagram Example - Taxi Service

UML Use Case Diagram Taxi Service - This sample was created in ConceptDraw DIAGRAM diagramming and vector drawing software using the UML Use Case Diagram library of the Rapid UML Solution from the Software Development area of ConceptDraw Solution Park. This sample shows the work of the taxi service and is used by taxi stations, by airports, in the tourism field and delivery service.

Create UML Diagram

This sample is a UML Class Diagram that shows the banking system. The classes represented as boxes with attributes and are connected with dependency and synchronous message associations. The associations are indicated with the multiplicity 1..*. This sample can be used by the banks, by financial enterprises.

UML Package Diagram

UML Package diagramming software with rich examples and template.

Sales Process Management

Sales process management is a business discipline which focuses on the development and practical application of various sales techniques, and on the management of sales operations of the company.

It is effective to use professional software for the sales process management. ConceptDraw DIAGRAM diagramming and vector drawing software extended with Sales Flowcharts solution from the Marketing area of ConceptDraw Solution Park is the best choice.

Computer Network. Computer and Network Examples

A Computer Network is a telecommunication network containing the set of nodes (computer network devices, such as computers, phones, servers) and allows them exchange the data using the network links. There are many kinds of computer networks. The primary difference is their size, according to the scale they can be classified as: Local area network (LAN), Metropolitan area network (MAN), Global Area Network (GAN), Wide area network (WAN), Storage area network (SAN), Campus area network (CAN), Personal area network (PAN). Computer networks also differ by connection method according to the used hardware technology (Ethernet, Wireless LAN, Optical fiber, HomePNA, Power line communication), by functional relationships that exist between network elements (Client-server, Active Networking, Peer-to-peer), by network topology (Tree computer network, Bus network, Star network, Ring network, Mesh network, etc.). Solutions of Computer and Networks Area from ConceptDraw Solution Park contain powerful drawing tools for easy designing diagrams for any Computer Network from listed diversity.

Diagramming Software for Design UML Component Diagrams

UML Component Diagram illustrate how components are wired together to larger components and software systems that shows the structure of arbitrarily complex systems. ConceptDraw Rapid UML solution delivers libraries contain pre-designed objects fit UML notation, and ready to draw professional UML Component Diagram.

Bubble diagrams with ConceptDraw DIAGRAM

Using ConceptDraw you will be able to create bubble diagrams from the ready ConceptDraw library objects or make your own objects. The created diagram can be saved and edited, objects can be moved and links between them will be automatically repainted after object moving because of using the ConceptDraw connectors.

Beauty in nature Illustrations and Clipart

Nature solution expands our software possibilities to create beautiful illustrations and cliparts with the new library which contains 17 vector objects.

Pyramid Diagram

The representation of data in a hierarchical or pyramid-like form is one of the most effective and illustrative ways of structuring the data, information, ideas in different fields, among them marketing, management, business, finances, sales, consulting, media, and some others. Pyramid Diagram perfectly suits for this goal, especially if we talk about the representing some marketing strategies, information systems, social strategies. Pyramid Diagram looks like a triangle or reversed triangle that is divided visually on several layers. Each layer can be colored with its own color, this lets visually highlight important moments. ConceptDraw DIAGRAM diagramming and vector graphics software extended with Pyramid Diagrams solution from the Marketing area provides powerful drawing tools, templates, samples, and built-in vector pyramid objects, thus all required tools for equally easy drawing Three level pyramid diagram, Four level pyramid model, Five level pyramid, etc., at this your Pyramid diagrams can have 2D or 3D view as you like.
The vector stencils library "Sales workflow" contains 39 sales workflow symbols.
Use these sales icon set to draw your sales flowcharts, workflow diagrams and process charts with the ConceptDraw PRO diagramming and vector drawing software.
The sales pictograms library "Sales workflow" is included in the Sales Flowcharts solution from the Marketing area of ConceptDraw Solution Park.
Accounting software
Accounting software, accounting software,
Accounts
Accounts, accounts,
Activities
Activities, activities,
ATM
ATM, ATM,
Call-taker, man
Call-taker, man, call taker, man,
Call-taker, woman
Call-taker, woman, call taker, woman,
Cash register
Cash register, cash register,
Contacts
Contacts, contacts,
Credit card transactions
Credit card transactions, credit card transactions,
Dealer
Dealer, dealer,
Direct mail
Direct mail, direct mail,
Dispatcher, man
Dispatcher, man, dispatcher, man,
Dispatcher, woman
Dispatcher, woman, dispatcher, woman,
Distribution point
Distribution point, distribution point,
Electronic mall
Electronic mall, electronic mall,
Invoice
Invoice, invoice,
Landing page
Landing page, landing page,
Lead
Lead, lead,
Lead conversion
Lead conversion, lead conversion, lead,
Leads
Leads, leads,
New products
New products, new products,
Nurturing
Nurturing, nurturing,
Online bank
Online bank, online bank,
Online order
Online order, online order,
Online payment
Online payment, online payment,
Products on sale
Products on sale, products on sale,
Product database
Product database, product database,
Product
Product, product,
Opportunities
Opportunities, opportunities,
Prospects
Prospects, prospects,
Proforma invoice
Proforma invoice, proforma invoice,
Sales
Sales, sales, leads,
Sales funnel
Sales funnel, sales funnel,
Sales manager, man
Sales manager, man, sales manager, man,
Sales manager, woman
Sales manager, woman, sales manager, woman,
Sales orders
Sales orders, sales orders,
Sales representative
Sales representative, sales representative,
Shipping provider
Shipping provider, shipping provider,
Social profile
Social profile, social profile,

Cisco Routers. Cisco icons, shapes, stencils and symbols

Network infrastructure planning is a very important process in the network construction, and the share of time allocated to this within the scope of the entire project may reach 60-80%. A competent and thorough approach to planning contributes to the quick investment return, and also increases the reliability and flexibility of the final system, reducing the probability of additional costs related to the incorrect implementation. Any planning begins with an analysis of the business requirements to the final system. Basic network parameters, which should be assessed are the scalability, accessibility, cost, speed and safety. Speed and cost are often mistaken for the most important parameters, and the rest of the parameters aren't even remembered. This is not entirely correct. Initially, it is necessary to assess the business plans for the future, because sometimes it is more profitable to invest more money in the beginning. If the business is to develop, then, consequently, demands on

Active Directory Diagram

Active Directory (AD) is a directory management service introduced by Microsoft Corporation for Windows domain networks. This service uses the Lightweight Directory Access Protocol (LDAP) and provides quick access to the included information about large structural units such as domains, organizational units, sites, and also about simple objects, such as users names with detailed information about them - contacts information, access rights, etc. Active Directory Diagram is a representation of the network structure in clear graphical format. It is a scheme of correlations of service components with preset degree of detailed elaboration. Active Directory Diagram makes the work of network administrators with Active Directory network structure more easy and convenient, allows plan and service the network quicker and more qualitatively. The help of ConceptDraw DIAGRAM software extended with Active Directory Diagrams solution from the Computer and Networks area is indispensable for easily and quickly creation the highly detailed Active Directory Diagrams.

UML Deployment Diagram. Design Elements

UML Deployment diagram describes the hardware used in system implementations and the execution environments and artifacts deployed on the hardware. ConceptDraw has 393 vector stencils in the 13 libraries that helps you to start using software for designing your own UML Diagrams. You can use the appropriate stencils of UML notation from UML Deployment library.