This example was designed on the base of Wikimedia Commons file: Block diagram showing an iterative and adaptive decision strategy (US CCSP).svg.
"These block diagrams show two decision strategies:
A is a decision strategy in which nothing is done until research resolves all key uncertainties
B is an iterative and adaptive decision strategy, where action is taken before all key uncertainties are resolved."
[commons.wikimedia.org/ wiki/ File:Block_ diagram_ showing_ an_ iterative_ and_ adaptive_ decision_ strategy_ (US_ CCSP).svg]
"Granger Morgan et al. (2009) recommend that an appropriate response to deep uncertainty is to adopt an iterative and adaptive decision-making strategy. This contrasts with a strategy in which no action is taken until research resolves all key uncertainties." [Economics of global warming. Wikipedia]
The flowchart example "Decision strategies" was designed using ConceptDraw software extended with Decision Making solution from Management area of ConceptDraw Solution Park.
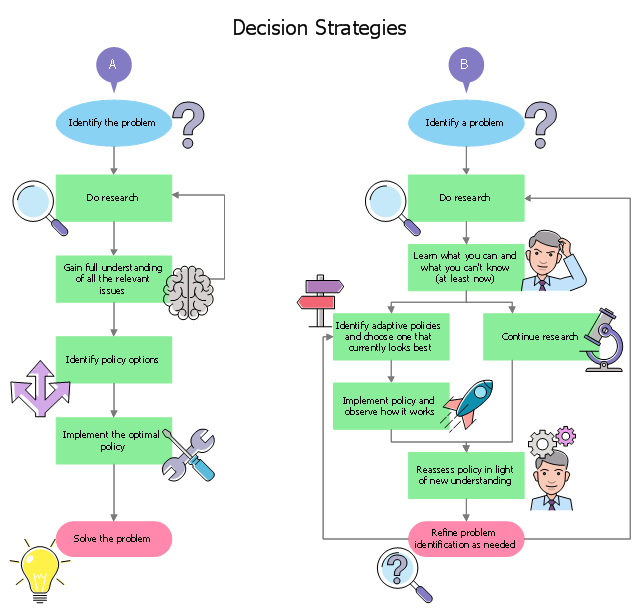
Decision diagram example
"Consumption of energy resources, (e.g. turning on a light) requires resources and has an effect on the environment. Many electric power plants burn coal, oil or natural gas in order to generate electricity for energy needs. While burning these fossil fuels produces a readily available and instantaneous supply of electricity, it also generates air pollutants including carbon dioxide (CO2), sulfur dioxide and trioxide (SOx) and nitrogen oxides (NOx). Carbon dioxide is an important greenhouse gas which is thought to be responsible for some fraction of the rapid increase in global warming seen especially in the temperature records in the 20th century, as compared with tens of thousands of years worth of temperature records which can be read from ice cores taken in Arctic regions. Burning fossil fuels for electricity generation also releases trace metals such as beryllium, cadmium, chromium, copper, manganese, mercury, nickel, and silver into the environment, which also act as pollutants.
The large-scale use of renewable energy technologies would "greatly mitigate or eliminate a wide range of environmental and human health impacts of energy use". Renewable energy technologies include biofuels, solar heating and cooling, hydroelectric power, solar power, and wind power. Energy conservation and the efficient use of energy would also help." [Energy industry. Environmental impact. Wikipedia]
The Energy resources diagram example was created in the ConceptDraw PRO diagramming and vector drawing software using the Manufacturing and Maintenance solution from the Illustration area of ConceptDraw Solution Park.
Infographics

 Manufacturing and Maintenance
Manufacturing and maintenance solution extends ConceptDraw DIAGRAM software with illustration samples, templates and vector stencils libraries with clip art of packaging systems, industrial vehicles, tools, resources and energy.
- Energy resources diagram | Global Warming Flow Chart
- Flow Chart On Global Warming
- Energy resources diagram | Chart Examples | Chart Templates ...
- Chart Examples | Chemistry Drawings | Sources Of Energy ...
- Energy resources diagram | Manufacturing and Maintenance | Pie ...
- Manufacturing and Maintenance | Energy resources diagram ...
- Energy resources diagram | Flow Chart For Carbon Dioxide From ...
- Audit process flowchart (multipage) | Energy Conservetion Flowchars
- Types of Flowcharts | Energy resources diagram | Pie Charts | Solar ...
- Manufacturing and Maintenance | Energy resources diagram | Flow ...