Cross-Functional Flowchart
Use of Cross-Functional Flowchart is a clear way of showing each team member’s responsibilities and how processes get shared or transferred between different responsible people, teams and departments. Use the best flowchart maker ConceptDraw PRO with a range of standardized cross-functional flowchart symbols to create the Cross-Functional Flowcharts simply and to visualize the relationship between a business process and the functional units responsible for that process. To draw the most quickly Cross-Functional Flowcharts, Cross Functional Process Maps, or Cross Functional Process Flow Diagrams, start with a Cross-functional flowchart samples and templates from ConceptDraw Solution Park. The ConceptDraw Arrows10 and RapidDraw technologies will be also useful for you in drawing. ConceptDraw PRO supports designing both types - horizontal and vertical Cross-functional flowcharts. A vertical layout makes the accents mainly on the functional units while a horizontal layout - on the process. If you need a Visio alternative in Mac OS X, try ConceptDraw PRO. Its interface is very intuitive and it’s actually much easier to use than Visio, yet somehow it’s just as powerful if not more so. ConceptDraw PRO performs professional quality work and seamless Visio interaction.
Example of DFD for Online Store (Data Flow Diagram) DFD Example
Data Flow Diagram (DFD) is a methodology of graphical structural analysis and information systems design, which describes the sources external in respect to the system, recipients of data, logical functions, data flows and data stores that are accessed. DFDs allow to identify relationships between various system's components and are effectively used in business analysis and information systems analysis. They are useful for system’s high-level details modeling, to show how the input data are transformed to output results via the sequence of functional transformations. For description of DFD diagrams are uses two notations — Yourdon and Gane-Sarson, which differ in syntax. Online Store DFD example illustrates the Data Flow Diagram for online store, the interactions between Customers, Visitors, Sellers, depicts User databases and the flows of Website Information. ConceptDraw PRO enhanced with Data Flow Diagrams solution lets you to draw clear and simple example of DFD for Online Store using special libraries of predesigned DFD symbols.
 Event-driven Process Chain Diagrams
Event-driven Process Chain (EPC) Diagram is a type of flowchart widely used for modeling in business engineering and reengineering, business process improvement, and analysis. EPC method was developed within the Architecture of Integrated Information Systems (ARIS) framework.
 Audio, Video, Media
Use it to make professional-looking documents, impressive presentations, and efficient websites with colorful and vivid illustrations and schematics of digital audio, video and photo gadgets and devices, audio video connections and configurations, S Video connection, HD and 3D television systems, home entertainment systems, Closed-circuit television (CCTV) surveillance systems. All audio video schematics, drawings and illustrations designed in ConceptDraw PRO are professional looking, clear and understandable for all thanks to applying the most commonly used standards of designations, and are effective for demonstrating in front of a small audience and on the big screens.
Amazon Cloud
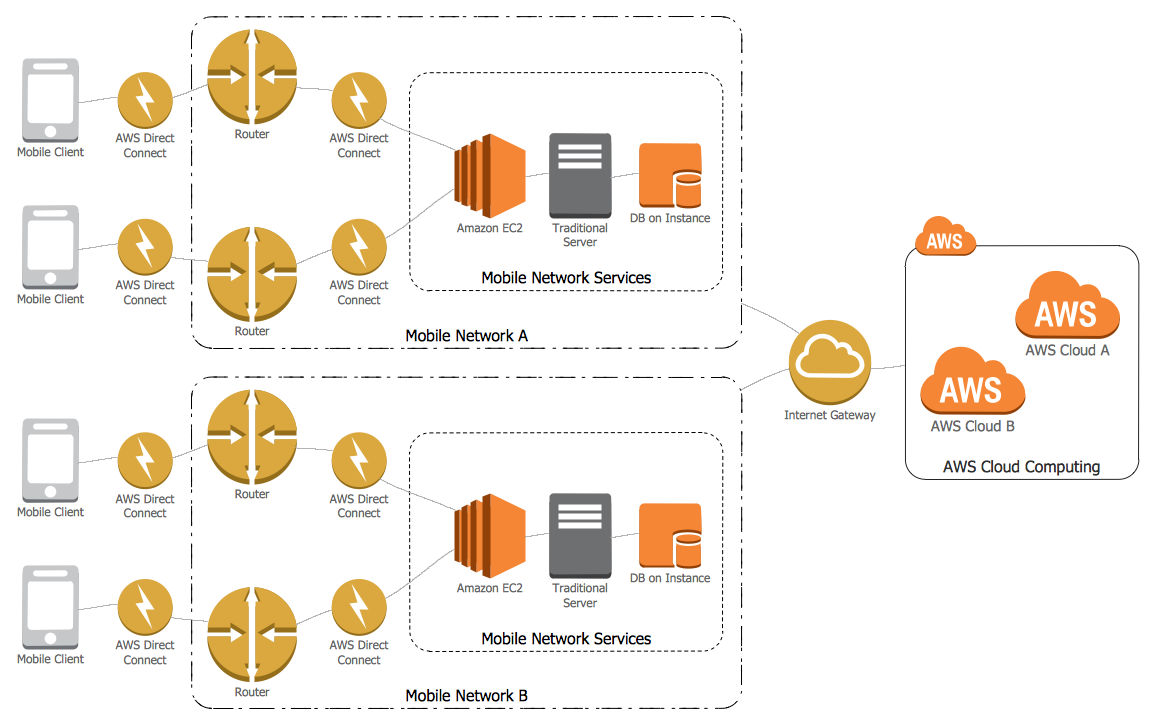
Data storage in clouds is very popular and widely used in the modern world. The Amazon is one of the companies which provide this service. Amazon Web Services offers the inexpensive and reliable cloud computing services, that's why many large companies prefer the Amazon Cloud for storage and operating their data. It is convenient to draw various AWS diagrams explaining the use of amazon cloud with help of tools of AWS Architecture Diagrams Solution from the Computer and Networks Area of ConceptDraw Solution Park.Tree Network Topology Diagram
A Tree network topology (Hierarchical topology) is a hybrid network topology that contains the combination of two or more star networks connected via bus networks. Each star network is a LAN (local area network) with central computer or server and workstation nodes connected to it. The central computers of star networks are connected to a main cable that is called a bus. Each node of the Tree network can have an arbitrary number of child nodes, you can easy add/remove the separate workstations and even the whole star networks, the failure of one workstation will not affect the work of others. This topology is ideal solution when workstations are located in groups within a small physical region, rarely is used in WAN configurations. Computer and Networks solution from Computer and Networks area of ConceptDraw Solution Park contains templates, samples and numerous libraries of predesigned vector stencils of computer network devices and equipment, which can be effectively used for designing various network topologies diagrams, including Tree Network Topology.Sales Process Flowchart Symbols
The most easier way of creating the visually engaging and informative Sales Process Flowchart is to create the new ConceptDraw document and to use the predesigned vector symbols offered in 6 libraries of the Sales Flowchart Solution. There are more than six types of sales process flow diagrams, ConceptDraw PRO software is flowchart maker which include six collections of extended flowchart symbols for effective diagramming. There are main collections of color coded flowchart symbols: Sales Department, Sales Steps, Sales Workflow, Sales Symbols and special set of Sales Arrows and Sales Flowchart.HelpDesk
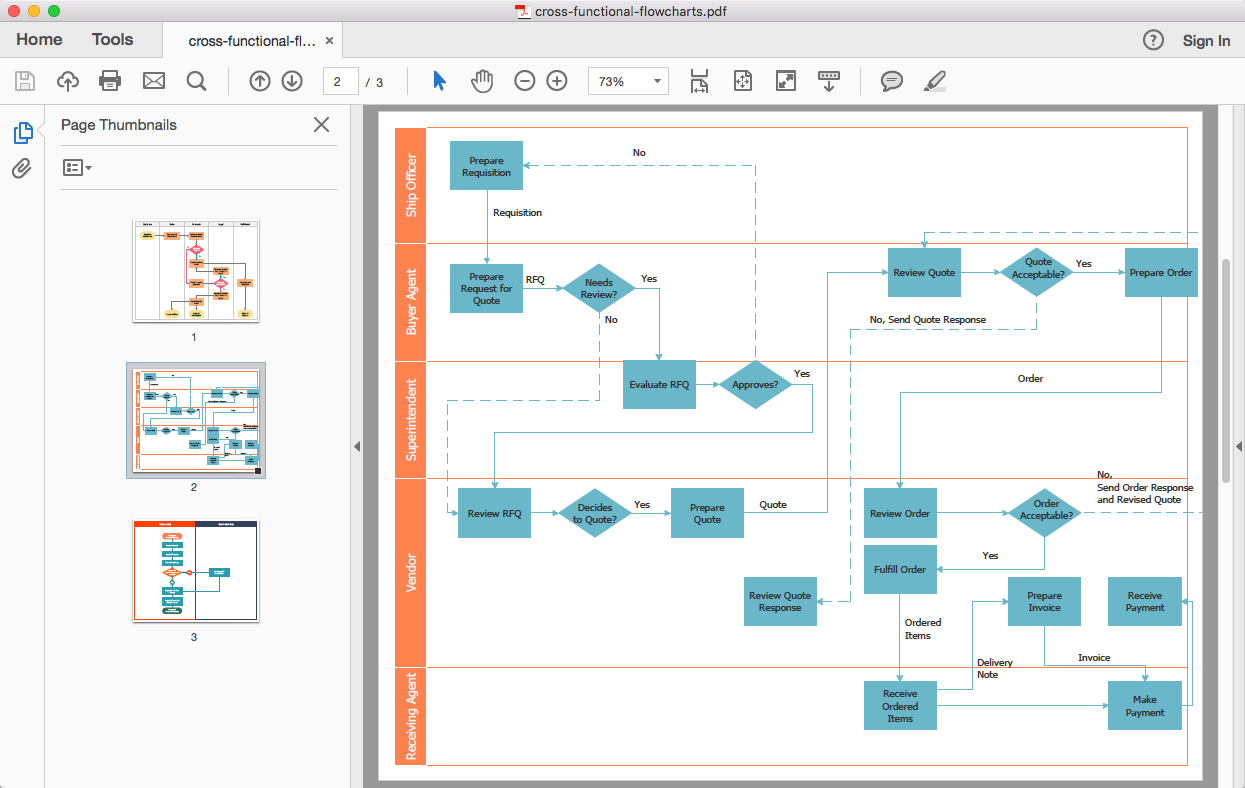
How to Add a Cross-Functional Flowchart to Adobe PDF
ConceptDraw PRO allows you to easy share your business process documentation between different computers with different operating systems and applications using it's export capabilities. You can get your cross-functional flowcharts in pdf format and avoid any problems while communicating them.
 Interactive Voice Response Diagrams
Interactive Voice Response Diagrams solution extends ConceptDraw PRO v10 software with samples, templates and libraries of ready-to-use vector stencils that help create Interactive Voice Response (IVR) diagrams illustrating in details a work of interactive voice response system, the IVR system’s logical and physical structure, Voice-over-Internet Protocol (VoIP) diagrams, and Action VoIP diagrams with representing voice actions on them, to visualize how the computers interact with callers through voice recognition and dual-tone multi-frequency signaling (DTMF) keypad inputs.
Wireless Network WAN
Wireless Networks solution from ConceptDraw Solution Park extends ConceptDraw PRO diagramming and vector drawing software to help network engineers and designers efficiently design, create and illustrate WAN network diagram of any complexity. The ConceptDraw PRO software helps users to quickly transit from an idea to the implementation of a Wireless Network WANCross-Functional Flowchart Basics
Don't let your first glance fool you. ConceptDraw is a lot easier to use than it looks. Use its cross-functional templates and library as basics to get started. All you need to know are a few basic steps and terms. ConceptDraw Arrows10 Technology is a new age in drawing software. Use it for process flows and its new rapid draw feature enables to draw an impressive charts in a seconds.
 Sales Flowcharts
The Sales Flowcharts solution lets you create and display sales process maps, sales process workflows, sales steps, the sales process, and anything else involving sales process management.
- Draw A Flow Chart On Mobile Phone Purchase Decision Making
- Flowchart On Decision Making Process Of Buying Mobile Phone
- How Mobile Work Flow Chart
- Flowchart For Manufacturing A Phone
- Sample Phone Flow Chart
- Basic Flowchart Images. Flowchart Examples | Purchase Process ...
- Cross Functional Business Process Flowchart For Cell Phone
- Credit Card Order Process Flowchart . Flowchart Examples | Event ...
- Mobile Phone Flowchart
- Data Flow Diagram Process | Purchase Process Flow Chart ...
- Production Flow Chart Of A Phone
- Basic Flowchart Symbols and Meaning | Process Flowchart ...
- Flow Chart Purchasing Mobile From Store
- Cross-Functional Flowchart | Process Flowchart | Purchase Process ...
- Process Flowchart | Basic Flowchart Symbols and Meaning | Sales ...
- Online store social media response flowchart | Example of DFD for ...
- Flow Of Purchasing Decision
- Basic Flowchart Symbols and Meaning | Example Process Flow ...
- Basic Flowchart Symbols and Meaning | Cross-Functional Flowchart ...
- Mobile Phone Diagram Symbols


