This site uses cookies. By continuing to browse the ConceptDraw site you are agreeing to our Use of Site Cookies.

Accounting Flowchart Purchasing Receiving Payable and Payment

Accounting flowchart is a pictorial way to represent the flow of data in an organization and the flow of transactions process in a specific area of its accounting or financial department. Accounting Flowcharts solution contains the full set of standardized accounting flowchart symbols which will help you design in minutes various types of Accounting Flowcharts including such popular diagrams which represent the whole accounting process: Purchasing Flowchart, Receiving Flowchart, Voucher Payable Flowchart, Treasurer Flowchart, Payment Flowchart.

Flow chart Example
Warehouse Flowchart

Warehouse Flowcharts are various diagrams that describe the warehousing and inventory management processes on the warehouses. Typical purposes of Warehouse Flowcharts are evaluating warehouse performance, measuring efficiency of customer service and organizational performance. This type of Workflow diagrams can be used for identifying any disconnection between business activities and business objectives. They are effectively used by warehouse-related people and organizations, manufacturers, wholesalers, exporters, importers, transporters, and others. Standard Warehousing process flow diagram and standard Workflow diagram are used for process identification for further evaluating effectiveness and profitability of overall business process. Use the ConceptDraw DIAGRAM ector graphic software extended with Flowcharts solution to design your own professional-looking Workflow diagrams and Flowcharts of any types, including the Warehouse flowchart, Process flow diagrams which depict in details all steps of Warehouse packages flow. Microsoft Visio, designed for Windows users, can’t be opened directly on Mac. But fortunately, there are several Visio alternatives for Mac which will help Mac users to work Visio files. With ConceptDraw DIAGRAM , you may open, edit and save files in Visio format.
ConceptDraw Arrows10 Technology

Sales Process Flowchart
Flowchart Examples

Sales Process Flowchart is an invaluable tool for business. It gives you opportunity to visualise and better understand the sales process, reveal and also visually highlight issues or bottlenecks, and predict the number of sales. The Flowchart is ideal method to represent in details all steps of the process, tasks and decisions needed to obtain maximum effectiveness and success. The steps are graphically represented by boxes linked with arrows indicating direction of the workflow, decision is shown by diamond. The sales process is closely linked to the company's success and usually includes the following main steps: Product knowledge, Prospecting, Planning the sale (Pre-approach), Approach, Need assessment, Presentation, Meeting objections, Gaining commitment, Follow-up. Create fast and easy your own Flowcharts of sales business processes using the ConceptDraw DIAGRAM ector graphic software extended with Cross-Functional Flowcharts solution from Business Processes area and also Sales Flowcharts solution from Marketing area of ConceptDraw Solution Park.
"An invoice, bill or tab is a commercial document issued by a seller to a buyer, relating to a sale transaction and indicating the products, quantities, and agreed prices for products or services the seller has provided the buyer.
Payment terms are usually stated on the invoice. These may specify that the buyer has a maximum number of days in which to pay, and is sometimes offered a discount if paid before the due date. The buyer could have already paid for the products or services listed on the invoice.
In the rental industry, an invoice must include a specific reference to the duration of the time being billed, so in addition to quantity, price and discount the invoicing amount is also based on duration. Generally each line of a rental invoice will refer to the actual hours, days, weeks, months, etc., being billed.
From the point of view of a seller, an invoice is a sales invoice. From the point of view of a buyer, an invoice is a purchase invoice. The document indicates the buyer and seller, but the term invoice indicates money is owed or owing. ...
Payment of invoices.
Organizations purchasing goods and services usually have a process in place for approving payment of invoices based on an employee's confirmation that the goods or services have been received.
Typically, when paying an invoice, a remittance advice will be sent to the supplier to inform them their invoice has been paid." [Invoice. Wikipedia]
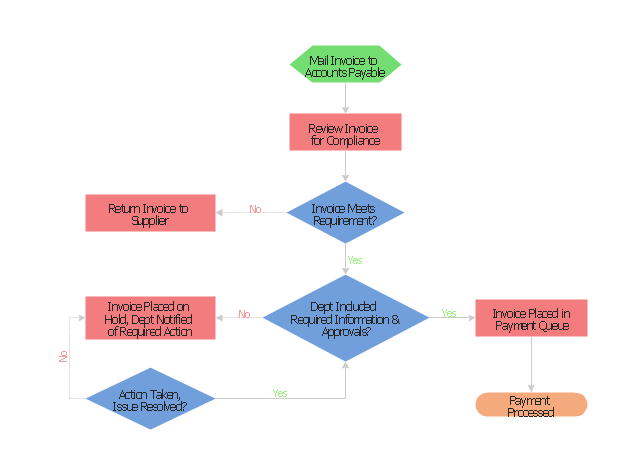
The flow chart example "Invoice payment process" was created using the ConceptDraw PRO diagramming and vector drawing software extended with the Flowcharts solution from the area "What is a Diagram" of ConceptDraw Solution Park.
Flowchart - Invoice payment process
Flowchart - Invoice payment process, terminator, process, preparation, decision,
Used Solutions

cross-functional flowchart template, flowchart, example business process flow Cross-Functional Flowcharts

cross-functional flowchart template, flowchart, example business process flow
The Cross-Functional Flowcharts solution extends ConceptDraw DIAGRAM software with cross functional flowchart examples, samples, and libraries of cross functional flow chart vector design elements and CH-1 symbols for easy drawing professional-looking and illustrative Cross Functional Flowchart, Cross Functional Diagram, CH-1 Diagram, Process Flowchart, Deployment Flowchart, Opportunity Flowchart, Swimlane Process Mapping Diagram, or Visio Cross Functional Flowchart for planning and further analyzing, optimizing and improvement processes. The use of included pre-made cross functional flowchart template, opportunity flowchart template, and swimlane process map template, greatly easier designing your Cross-functional flowcharts.

Flowcharts

We have a lot of samples of flowchart diagrams for your needs.
The vector stencils library "Shopping pictograms" contains 20 icons of shop, store and trade symbols. Use it to draw your pictorial infograms. The example "Shopping pictograms - Vector stencils library" was created using the ConceptDraw PRO diagramming and vector drawing software extended with the Pictorial infographics solution from the area "What is infographics" in ConceptDraw Solution Park.
Sale
Sale, sale, discounts,
New
New, new,
Shopping basket
Shopping basket, shopping basket,
Shopping cart
Shopping cart, shopping cart,
Market
Market, market, store,
Cashier machine
Cashier machine, cashier machine, cash till, cash,
Check
Check, check, bill,
Shopping bag
Shopping bag, shopping bag,
Price tag
Price tag, price tag, label,
Buying
Buying, buying, shopping,
Dummy
Dummy, mannequin, dummy, fashion,
Hanger
Hanger, hanger,
Delivery
Delivery, delivery,
Free shipping
Free shipping, free shipping,
Gift
Gift, gift,
Money
Money, money, cash, payment, currency, finance,
Payment
Payment, payment, pay,
Credit card
Credit card, credit card, cashless payment,
Online shopping
Online shopping, online shopping,
Open around the clock
Open around the clock, open around the clock,

Looking at ConceptDraw MINDMAP as a Replacement for Mindjet Mindmanager

The comparing of ConceptDraw MINDMAP to Mindjet Mindmanager allows to identify a lot of benefits. At first, the ConceptDraw MINDMAP has a lower price, the flexible licensing, the license is per-named-user, no charge for major product upgrades and no charge for support. ConceptDraw MINDMAP is effective for launching the stalled projects to new heights, it possess the excellent possibility of importing and exporting to other mind mapping program file formats. ConceptDraw MINDMAP easily integrates with wide set of programs, among them Evernote, Skype, Twitter, Microsoft Word, Microsoft PowerPoint, Microsoft Project, Mindjet Mindmanager, ConceptDraw PROJECT, ConceptDraw DIAGRAM , with solutions from ConceptDraw Solution Park. Now you have a freedom to choose the best format for each your document, it is incredibly easy to make the Skype presentation, to take and share critical information, to send your Mind Map to Evernote, to import / export MS Word documents, MS PowerPoint presentations, the project data, open and save Mindmanager files, to map out the long-term Twitter messages and publish them to your Twitter account directly from a Mind Map.

Must Have Suggestion

The increasing of sales directly depends from the improvement and perfection of the product and from adding new features must-have according to the customers' opinion. In this regard, it is important to have constant feedback with customers, to analyze their questions and make conclusions, to conduct various surveys, to maintain statistics, to monitor changes and market's improvement in a given segment. Heed to customers feedback, respond quickly to requests, consider proposals for improvements to develop your business, to increase the client orientation and competitiveness. The competition makes business more interesting and effective, that's why it is important to analyze the market, as well as the successes and suggestions of other companies in this field. In many cases detailed analysis will help to detect the trends and understand what features are in demand at the moment. This is very important, because timely addition of relevant features and effective possibilities in many cases helps to dramatically increase the popularity of the product and accordingly the volume of its sales. Don't be afraid to follow the expectations of your customers and surprise them also. This action Mind Map helps correctly respond to feature suggestions made by customers and for requirements related to must-have features. The example contains ready to use response phrases.

Pie Chart Word Template. Pie Chart Examples

The Pie Chart visualizes the data as the proportional parts of a whole and looks like a disk divided into sectors. The pie chart is type of graph, pie chart looks as circle devided into sectors. Pie Charts are widely used in the business, statistics, analytics, mass media. It’s very effective way of displaying relative sizes of parts, the proportion of the whole thing.

Cause and Effect Diagram Software

The Cause and Effect diagram introduced by Kaoru Ishikawa in 1968 is a method for analyzing process dispersion. It can help you to dive into a problem and find an effective solution, identify and represent the possible causes for an effect, analyze the complex business problems and successfully solve them. You can design your Cause and Effect diagram on a paper, but more effective way is to use specific software - ConceptDraw DIAGRAM is a powerful Cause and Effect Diagram Software. It helps you create Cause and Effect diagram known also as Fishbone diagram or Ishikawa diagram from templates and examples.

Pyramid Diagram

The representation of data in a hierarchical or pyramid-like form is one of the most effective and illustrative ways of structuring the data, information, ideas in different fields, among them marketing, management, business, finances, sales, consulting, media, and some others. Pyramid Diagram perfectly suits for this goal, especially if we talk about the representing some marketing strategies, information systems, social strategies. Pyramid Diagram looks like a triangle or reversed triangle that is divided visually on several layers. Each layer can be colored with its own color, this lets visually highlight important moments. ConceptDraw DIAGRAM diagramming and vector graphics software extended with Pyramid Diagrams solution from the Marketing area provides powerful drawing tools, templates, samples, and built-in vector pyramid objects, thus all required tools for equally easy drawing Three level pyramid diagram, Four level pyramid model, Five level pyramid, etc., at this your Pyramid diagrams can have 2D or 3D view as you like.

climate change, waste management, esg, sustainability, diversity, supply chain, biodiversity Environmental, Social, and Corporate Governance

climate change, waste management, esg, sustainability, diversity, supply chain, biodiversity
The Environmental, Social, and Corporate Governance solution with diversity of drawing tools, libraries of pre-made vector elements, and thematic samples is the best to illustrate the key points of ESG, specify ESG criteria and ESG risks. This helps investors evaluate potential investments and avoid investment losses. Outline ESG factors and ESG standards to protect the environment, avoid climate change and biodiversity loss, illustrate principles of sustainability, waste management, supply chain management, and the importance of the use of renewable energy and renewable resources. Depict easily the policies of the companies that adhere to ESG standards.
The vector stencils library "Sales workflow" contains 39 sales workflow symbols.
Use these sales icon set to draw your sales flowcharts, workflow diagrams and process charts with the ConceptDraw PRO diagramming and vector drawing software.
The sales pictograms library "Sales workflow" is included in the Sales Flowcharts solution from the Marketing area of ConceptDraw Solution Park.
Accounting software
Accounting software, accounting software,
Accounts
Accounts, accounts,
Activities
Activities, activities,
ATM
ATM, ATM,
Call-taker, man
Call-taker, man, call taker, man,
Call-taker, woman
Call-taker, woman, call taker, woman,
Cash register
Cash register, cash register,
Contacts
Contacts, contacts,
Credit card transactions
Credit card transactions, credit card transactions,
Dealer
Dealer, dealer,
Direct mail
Direct mail, direct mail,
Dispatcher, man
Dispatcher, man, dispatcher, man,
Dispatcher, woman
Dispatcher, woman, dispatcher, woman,
Distribution point
Distribution point, distribution point,
Electronic mall
Electronic mall, electronic mall,
Invoice
Invoice, invoice,
Landing page
Landing page, landing page,
Lead
Lead, lead,
Lead conversion
Lead conversion, lead conversion, lead,
Leads
Leads, leads,
New products
New products, new products,
Nurturing
Nurturing, nurturing,
Online bank
Online bank, online bank,
Online order
Online order, online order,
Online payment
Online payment, online payment,
Products on sale
Products on sale, products on sale,
Product database
Product database, product database,
Product
Product, product,
Opportunities
Opportunities, opportunities,
Prospects
Prospects, prospects,
Proforma invoice
Proforma invoice, proforma invoice,
Sales
Sales, sales, leads,
Sales funnel
Sales funnel, sales funnel,
Sales manager, man
Sales manager, man, sales manager, man,
Sales manager, woman
Sales manager, woman, sales manager, woman,
Sales orders
Sales orders, sales orders,
Sales representative
Sales representative, sales representative,
Shipping provider
Shipping provider, shipping provider,
Social profile
Social profile, social profile,

Yourdon and Coad Diagram

The vector stencils library Yourdon and Coad Notation from the solution OOAD contains specific symbols of the Yourdon and Coad notation such as data store symbol, data process symbol, loop symbol for ConceptDraw DIAGRAM diagramming and vector drawing software. The OOAD solution is contained in the Software Development area of ConceptDraw Solution Park.
This BPMN (Business Process Model and Notation) collaboration diagram sample contains the collection of participants and their interaction throughout an application handling and invoicing process.
"An invoice, bill or tab is a commercial document issued by a seller to a buyer, relating to a sale transaction and indicating the products, quantities, and agreed prices for products or services the seller has provided the buyer.
Payment terms are usually stated on the invoice. These may specify that the buyer has a maximum number of days in which to pay, and is sometimes offered a discount if paid before the due date. The buyer could have already paid for the products or services listed on the invoice.
In the rental industry, an invoice must include a specific reference to the duration of the time being billed, so in addition to quantity, price and discount the invoicing amount is also based on duration. Generally each line of a rental invoice will refer to the actual hours, days, weeks, months, etc., being billed.
From the point of view of a seller, an invoice is a sales invoice. From the point of view of a buyer, an invoice is a purchase invoice. The document indicates the buyer and seller, but the term invoice indicates money is owed or owing." [Invoice. Wikipedia]
The business process modeling diagram example "Application handling and invoicing - Collaboration BPMN 2.0 diagram" was designed using the ConceptDraw PRO diagramming and vector drawing software extended with the Business Process Model and Notation solution from the Business Processes area of ConceptDraw Solution Park.
Business process modeling
Business process modeling, timer, task, smart sequence flow, smart message flow, none, start, none, end, message, horizontal pool, pool, exclusive gateway, data store, data association,

draw picture graph, draw picture chart, image chart, pictorial chart Picture Graphs

draw picture graph, draw picture chart, image chart, pictorial chart
Typically, a Picture Graph has very broad usage. They many times used successfully in marketing, management, and manufacturing. The Picture Graphs solution extends the capabilities of ConceptDraw DIAGRAM with the quick-start templates, samples, and a library of professionally developed vector stencils for designing attractive, colorful and remembered Picture Graphs on any thematic.