How to Create Flowcharts for an Accounting Information System
Accounting information is a system of interrelated processes which represent financial and accounting data, required for decision making. For representing the accounting processes in a visual and easy for perception form are constructed Accounting Flowcharts. For their creation are used special flowchart symbols, this makes Accounting flowcharts understandable for all users of accounting information system and helps them easy understand the sequence of steps involved to accounting processes. But how to create Flowcharts for an Accounting Information System fast and easy? Use of special design software is useful for this. ConceptDraw DIAGRAM software extended with Accounting Flowcharts solution is the best for creation accurate Accounting Flowcharts, for documentation and visually communication on how accounting processes work, how each operation is done. Accounting Flowcharts solution is supplied with library of predesigned commonly used vector symbols, Accounting Flowchart templates and samples demonstrating receiving, purchasing, payment, and other accounting processes.Process Flow Diagram Symbols
Chemical and Process Engineering Solution from the Industrial Engineering Area of ConceptDraw Solution Park is a unique tool which contains variety of predesigned process flow diagram symbols for easy creating various Chemical and Process Flow Diagrams in ConceptDraw DIAGRAM.Structured Systems Analysis and Design Method (SSADM) with ConceptDraw DIAGRAM
Structured Systems Analysis and Design Method (abbr. SSADM) is a method developed in Great Britain and accepted in 1993 as a national standard for information systems development and analysis. SSADM is based on Data Flow Diagrams and is characterized with presence of clear sequence of steps at projecting, analysis, and documenting of information system. It involves 6 main stages: analysis of existing system or estimation of practicability, requirements definition, determination of technical requirements and equipment cost, development of logical data model, projecting of logical requirements and specification them, physical projecting. Each of them is also divided into several steps defining the tasks that should be fulfilled at a given stage. The most important SSADM elements are flows modeling with help of DFD, data logic modeling with help of LDS (Logical Data Structure) and description of entities behavior. Applying of SSADM is easy with ConceptDraw DIAGRAM diagramming and vector drawing software and Data Flow Diagram solution.Entity Relationship Diagram Symbols
The semantic modeling method nowadays is successfully applied in database structure design. It is effective method of modeling the data structures, which is based on the meaning of these data. As a tool of semantic modeling, there are used different types of Entity-Relationship Diagrams. Entity Relationship Diagram (ERD) is applied to visually and clearly represent a structure of a business database. The main components of ERDs are: entity, relation and attributes. An entity is a class of similar objects in the model, each entity is depicted in the form of rectangle and has the name expressed by a noun. Relation is shown in the form of non-directional line that connects two entities. There are several notation styles used for ERDs: information engineering style, Chen style, Bachman style, Martin Style. The Entity Relationship Diagram symbols used for professional ERD drawing are predesigned by professionals and collected in the libraries of the Entity-Relationship Diagram (ERD) solution for ConceptDraw DIAGRAM software.Electrical Symbols — Switches and Relays
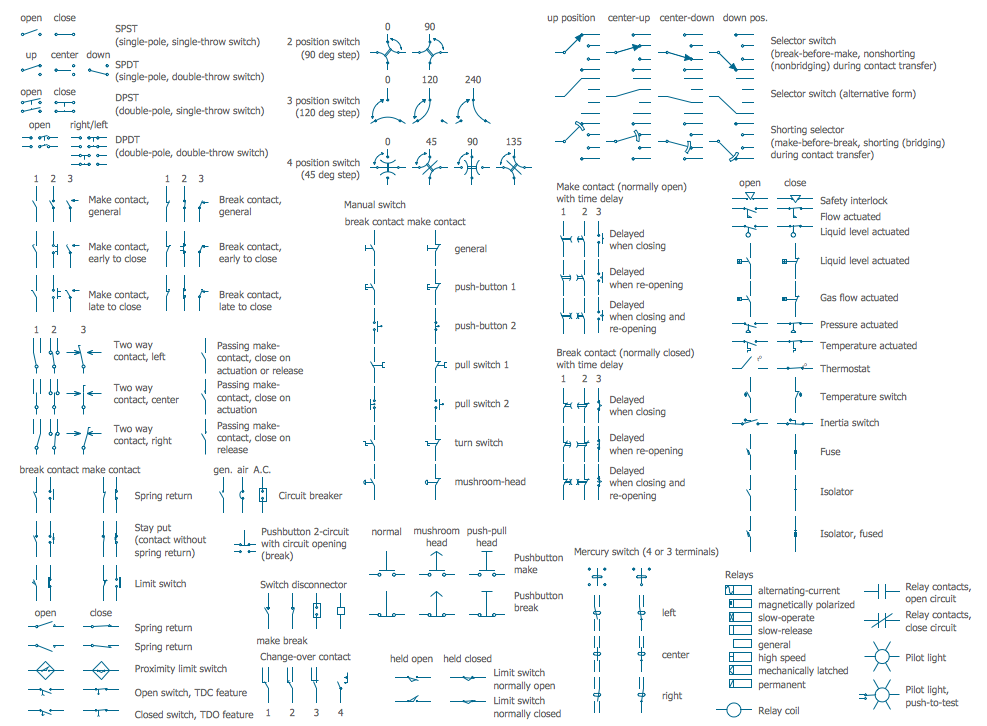
In electrical engineering, a switch is an electrical component that can break an electrical circuit, interrupting the current or diverting it from one conductor to another. The mechanism of a switch may be operated directly by a human operator to control a circuit (for example, a light switch or a keyboard button), may be operated by a moving object such as a door-operated switch, or may be operated by some sensing element for pressure, temperature or flow. A relay is a switch that is operated by electricity. Switches are made to handle a wide range of voltages and currents; very large switches may be used to isolate high-voltage circuits in electrical substations. 26 libraries of the Electrical Engineering Solution of ConceptDraw DIAGRAM make your electrical diagramming simple, efficient, and effective. You can simply and quickly drop the ready-to-use objects from libraries into your document to create the electrical diagram.Hybrid Network Topology
A network topology is the topological structure or the arrangement of different elements of computer network. There are several basic types of network topologies, such as star, ring, bus, mesh. But the most popular is a combination of two or more diverse basic network topologies, which is known as hybrid network topology. The examples of hybrid topology are: star-bus, star-ring topologies, etc. Each resulting hybrid topology has its own features, advantages and limitations of its components. Hybrid network topologies are more flexible, reliable, and have increased fault tolerance, the faults in them can be easily diagnosed and corrected, new nodes can be easily added. But at the same time hybrid topologies often are sufficiently expensive and difficult for managing. ConceptDraw DIAGRAM diagramming and vector drawing software supplied with the tools of Computer Network Diagrams solution from Computer and Networks area is perfect for schematic description various types of computer network topologies and easy designing Hybrid network topology diagrams.Office Layout
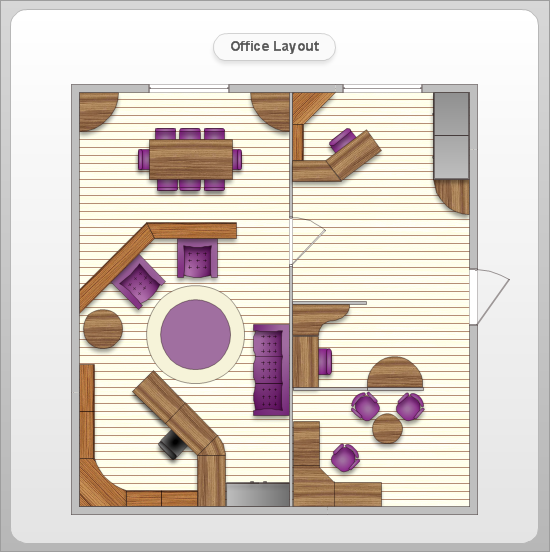
Each office is a unique space, thats why design of office premises has a lot of specifics based on the type of premise and kind of activity of the company which will be placed at this office. Different office concepts and features of office designs are also taken into consideration by designers and architects when office layout plans and designs are created, for construction new office buildings or renovation those built earlier. ConceptDraw DIAGRAM extended with Office Layout Plans solution from Building Plans area is a powerful diagramming and vector drawing software for designing Office Floor Plans, Office Layout Plans, Small Office Design Plans, Office Cabinet Plans, Commercial Floor plans, Home Office Plans, Plans for premises at large office centers, Electrical plans for offices, etc. Office Layout Plans solution includes 3 time-saving libraries of ready-to-use vector objects of office furniture and equipment which are incredibly helpful for design and implementation any of your office layout ideas.
Personal area (PAN) networks. Computer and Network Examples
Personal area network (PAN) is a network organized on a limited area and used for data transmission between various personal devices, such as computers, tablets, laptops, telephones, different digital and mobile devices, etc. and also for connecting to higher level network and Internet. PAN is used to manage the interconnections of IT devices which surround a single user and generally contains such appliances, as cordless mice, keyboard, phone, and Bluetooth handsets. PANs can be wired with computer buses, or wirelessly connected to the Internet using such network technologies as Bluetooth, Z-Wave, ZigBee, IrDa, UWB, Body Area Network. PANs have a lot of pros and cons, they are expedient, lucrative and handy, but sometimes have bad connection with other networks on the same radio bands, Bluetooth has distance limits and slow data transfer speed, but is comparatively safe. ConceptDraw DIAGRAM diagramming software supplied with numerous solutions of Computer and Networks Area included to ConceptDraw Solution Park perfectly suits for designing the Personal Area Networks.
- Process Flowchart | Export from ConceptDraw PRO Document to ...
- Path Analysis For Dummies
- Pert For Dummies
- Cross-Functional Flowchart | Dummy Activity On Critical Path
- Basic Audit Flowchart . Flowchart Examples | Audit Flowcharts | Audit ...
- Payroll process - Swim lane process mapping diagram | Audit ...
- Critical Path Analysis For Dummies
- Fishbone Diagrams | Google Cloud Platform | Workflow Diagram Of ...
- Diagram Of Acid Rain Or Sketch


