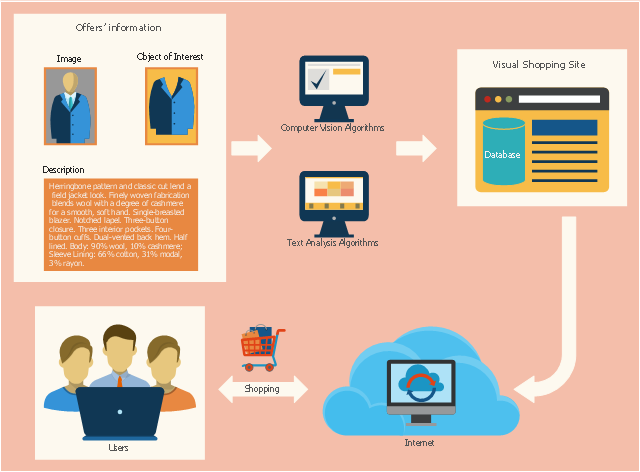
This sales flowchart example was redesigned from the Wikimedia Commons file: Visual shopping scheme.pdf. [commons.wikimedia.org/ wiki/ File:Visual_ shopping_ scheme.pdf]
"Online shopping (sometimes known as e-tail from "electronic retail" or e-shopping) is a form of electronic commerce which allows consumers to directly buy goods or services from a seller over the Internet using a web browser. Alternative names are: e-web-store, e-shop, e-store, Internet shop, web-shop, web-store, online store, online storefront and virtual store. Mobile commerce (or m-commerce) describes purchasing from an online retailer's mobile optimized online site or app." [Online shopping. Wikipedia]
The example "Visual shopping scheme" was created using the ConceptDraw PRO diagramming and vector drawing software extended with the Sales Flowcharts solution from the Marketing area of ConceptDraw Solution Park.
Online shopping flowchart
 Sales Flowcharts
The Sales Flowcharts solution lets you create and display sales process maps, sales process workflows, sales steps, the sales process, and anything else involving sales process management.
Circular Diagram

Manage Social Media Response Plan DFD

How to Use the ″Online Store PR Campaign″ Sample

The Sales Process

Example of DFD for Online Store (Data Flow Diagram)


Sales Process Map

The vector stencils library "Sales symbols" contains 55 sales pictograms.
Use these icon set to draw your sales flowcharts, workflow diagrams and process charts with the ConceptDraw PRO diagramming and vector drawing software.
The vector stencils library "Sales symbols" is included in the Sales Flowcharts solution from the Marketing area of ConceptDraw Solution Park.
Use these icon set to draw your sales flowcharts, workflow diagrams and process charts with the ConceptDraw PRO diagramming and vector drawing software.
The vector stencils library "Sales symbols" is included in the Sales Flowcharts solution from the Marketing area of ConceptDraw Solution Park.
Banknotes

Box

Businessman

Businesswoman

Cellphone caller, man

Cellphone caller, woman

Clerk, man

Clerk, woman

Client computer

Cloud

Coins

Computer monitor

Crate

Credit cards

Credit card American Express

Credit card China UnionPay

Credit card Discover

Credit card Master
Credit card Visa

Customer, man

Customer, woman

Data base

Disqualified

Document

Documents

Document folder

Email

Exporting

Man figure

Woman figure

Folder closed

Folder opened

Importing

International

Mail

Mobile

Notes

PayPal

Phone

Phone caller, man

Phone caller, woman

Presentation slide

Qualified

Server

Shopping bag, empty

Shopping bag, full

Shopping cart, empty

Shopping cart, full

Spreadsheet

Technician

Time

USB flash card

User

Web form

Web page

DFD Flowchart Symbols

Business diagrams & Org Charts with ConceptDraw DIAGRAM


Percentage Pie Chart. Pie Chart Examples

What Is a Concept Map

Business Board Org Chart

How To Make a Bubble Chart

Online Flow Chart

ConceptDraw DIAGRAM : Able to Leap Tall Buildings in a Single Bound

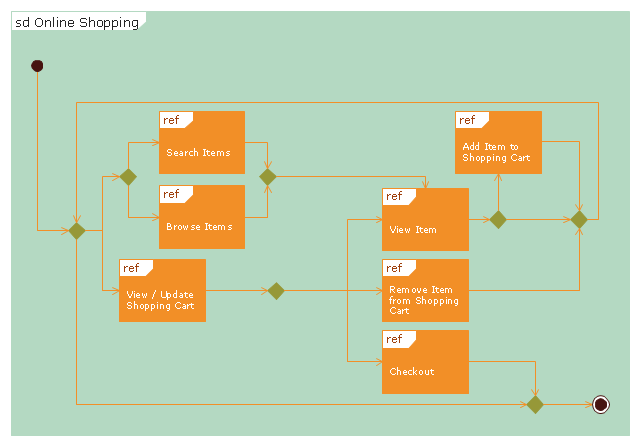
"Online shopping or e-shopping is a form of electronic commerce which allows consumers to directly buy goods or services from a seller over the Internet using a web browser. Alternative names are: e-web-store, e-shop, e-store, Internet shop, web-shop, web-store, online store, online storefront and virtual store. Mobile commerce (or m-commerce) describes purchasing from an online retailer's mobile optimized online site or app.
An online shop evokes the physical analogy of buying products or services at a bricks-and-mortar retailer or shopping center; the process is called business-to-consumer (B2C) online shopping. In the case where a business buys from another business, the process is called business-to-business (B2B) online shopping. The largest of these online retailing corporations are Alibaba, Amazon.com, and eBay. Retail success is no longer all about physical stores. This is evident because of the increase in retailers now offering online store interfaces for consumers. With the growth of online shopping, comes a wealth of new market footprint coverage opportunities for stores that can appropriately cater to offshore market demands and service requirements." [Online shopping. Wikipedia]
The UML interaction overview diagram example "Online shopping" was created using the ConceptDraw PRO diagramming and vector drawing software extended with the Rapid UML solution from the Software Development area of ConceptDraw Solution Park.
UML interaction overview diagram
How to Create a Social Media DFD Flowchart

- Sales Flowcharts | Flowchart For Online Shopping For Electronics
- UML Component Diagram Example - Online Shopping | Sales ...
- Visual shopping scheme | Flowchart Of Online Shopping Site
- Shopping pictograms - Vector stencils library | Online Marketing ...
- Example of DFD for Online Store (Data Flow Diagram ) | Visual ...
- Simple Diagramming - Online Shopping | Online Marketing Objectives
- Visual shopping scheme | ConceptDraw Solution Park | Flowchart ...
- Online store social media response flowchart | Social Media ...
- Online shop - Concept map | Marketing Diagrams | How to Draw a ...
- Choose the best car | Shopping Online | Online Marketing ...