This site uses cookies. By continuing to browse the ConceptDraw site you are agreeing to our Use of Site Cookies.

social media flow chart, social media marketing Social Media Response

social media flow chart, social media marketing
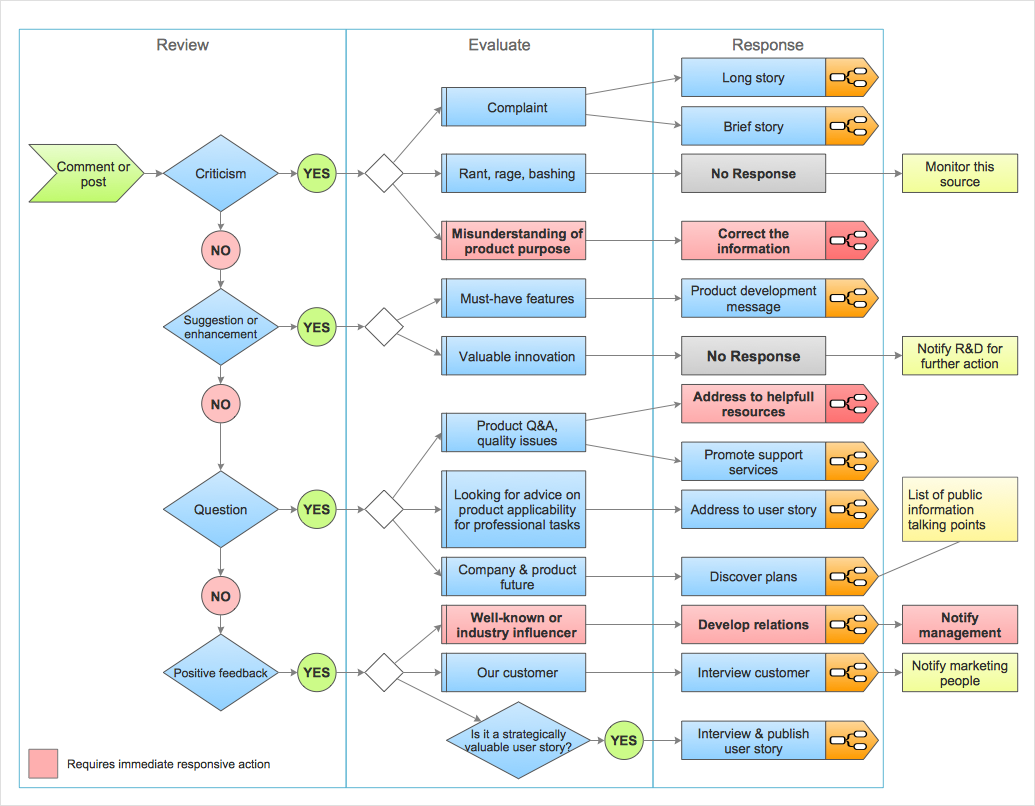
The Social Media Response Solution is a combination of innovative tools, ready-made libraries objects, templates, and samples of Interactive Flow Charts of any complexity and the Action Mind Maps, which were developed with a goal to help all people related with a social media to boost their social media success fast and easy. This solution extends ConceptDraw DIAGRAM and ConceptDraw MINDMAP with the ability to draw interactive flow charts with action mind map templates, to help create an effective response to applicable social media mentions.

UML Use Case Diagram Example. Social Networking Sites Project

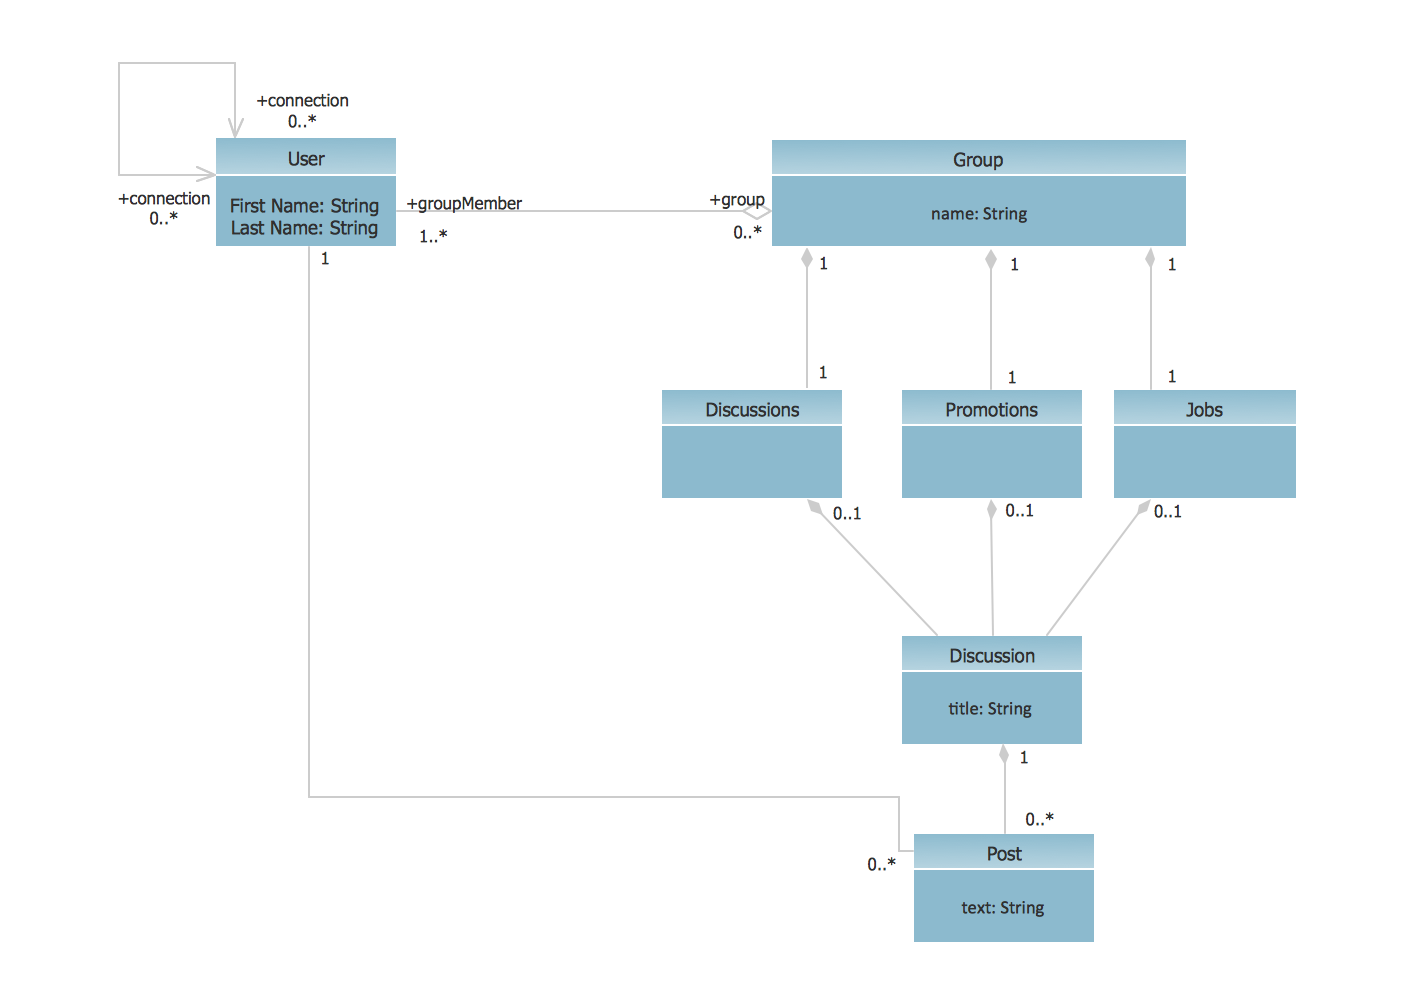
UML Diagrams Social Networking Sites Project. This sample was created in ConceptDraw DIAGRAM diagramming and vector drawing software using the UML Use Case Diagram library of the Rapid UML Solution from the Software Development area of ConceptDraw Solution Park. This sample shows the Facebook Socio-health system and is used at the projection and creating of the social networking sites.

Understanding the Audit Process: A Comprehensive Guide. Audit Process Flowchart

Audit Process Flowchart, Audit Flowchart - Audit Flowcharts solution for ConceptDraw DIAGRAM Solution Park provides the Audit Flowcharts library with wide variety of predesigned audit flowchart symbols, and also the set of templates and samples allowing you design your own audit flowchart or audit process flowchart in one moment. Simply use any of offered samples and change it for your needs, or fill the desired template.

Model Based Systems Engineering

ConceptDraw DIAGRAM is a professional diagramming and vector drawing software. Now, enhanced with SysML Solution from the Software Development Area of ConceptDraw Solution Park, ConceptDraw DIAGRAM became an ideal software for model based systems engineering (MBSE).

healthcare workflow diagram, healthcare workflow, healthcare workflow management, workflow analysis healthcare, clinical workflows in healthcare Healthcare Management Workflow Diagrams

healthcare workflow diagram, healthcare workflow, healthcare workflow management, workflow analysis healthcare, clinical workflows in healthcare
Healthcare Management Workflow Diagrams solution contains large set of colorful samples and libraries with predesigned vector pictograms and symbols of health, healthcare equipment, medical instruments, pharmaceutical tools, transport, medication, departments of healthcare organizations, the medical icons of people and human anatomy, flowchart objects, connectors, and arrows, which make it the best for designing clear and comprehensive Medical Workflow Diagrams and Block Diagrams, Healthcare Management Flowcharts and Infographics, Healthcare Workflow Diagram, for depicting the healthcare workflow and clinical workflows in healthcare, for making the workflow analysis healthcare and healthcare workflow management.

Healthcare, Health, biomedicine, Anatomy, Pharmacy, Medical, Immunology, Virology Health Package

Healthcare, Health, biomedicine, Anatomy, Pharmacy, Medical, Immunology, Virology
Health Package is a set of multifaceted solutions intended for visualization and illustration in a field of medicine and health, for drawing colorful, interesting and precise illustrations and infographics that will be used successfully in medical documents, articles, special magazines, posters, billboards, websites, presentations, collages. Having these solutions available, it will not be difficult to illustrate the medical editions, to convey the information in a full and interesting form, to teach students with use effective visual methods, to describe the medical facts, to tell about innovations in a field of medicine, health and correct nutrition, to explain the causes and consequences of different diseases, as well as the measures of their prevention and treatment.

cybersecurity, communications, homeland security, financial services, information technology, emergency services, energy sector Critical Infrastructure Sectors

cybersecurity, communications, homeland security, financial services, information technology, emergency services, energy sector
Critical Infrastructure Sectors solution for ConceptDraw DIAGRAM software provides a set of examples and vector stencil libraries for designing infographics and diagrams about means for the most efficient protection of critical infrastructure, energy sector, and rapid recovery in the case of disruptions. Illustrate your projects on the prevention of physical, environmental, and cyber threats, development of information technology and detection equipment. Improve your projects in communications, financial services, emergency services, homeland security, cybersecurity to solve critical issues efficiently and decrease the detrimental effects of disruptions on society and citizens. Show the results of testing new technologies and newest equipment for critical infrastructure protection and increasing resilience.

collaboration, diagram Collaboration Area

collaboration, diagram
The solutions from Collaboration area of ConceptDraw Solution Park extend ConceptDraw DIAGRAM and ConceptDraw MINDMAP software with features, samples, templates and vector stencils libraries for drawing diagrams and mindmaps useful for collaboration.

health informatics, healthcare informatics, healthcare design Health Informatics

health informatics, healthcare informatics, healthcare design
Health Informatics solution supplies the ConceptDraw DIAGRAM with tools and functionalities in a field of healthcare design and healthcare informatics. Including collection of professionally designed samples and a lot of high-quality health informatics vector design objects, it is the best for all medical workers and healthcare-related specialties when designing diagrams, schematics, flow charts, workflow charts, block diagrams, infographics, illustrations, and presentations slides in a field of Health Informatics, representing the newest medical information technologies, architectures of healthcare systems, principles of work of the specialized software, structures of health records systems, medical researches processes.

circle-spoke diagram, marketing diagrams Circle-Spoke Diagrams

circle-spoke diagram, marketing diagrams
Examples of subject areas that are well suited to this approach are marketing, business, products promotion, process modeling, market, resource, time, and cost analysis. Circle-Spoke Diagrams are successfully used in presentations, conferences, management documents, magazines, reportages, reviews, reports, TV, and social media.

ConceptDraw Solution Park ConceptDraw Solution Park

ConceptDraw Solution Park
ConceptDraw Solution Park collects graphic extensions, examples and learning materials

Flowcharts

We have a lot of samples of flowchart diagrams for your needs.

health science, allied health, public health, internal medicine Health Sciences

health science, allied health, public health, internal medicine
Health Sciences solution including professionally designed samples and wide range of high-quality vector icons and pictograms of basic medical sciences, surgery specializations, internal medicine, medical diagnostics, interdisciplinary fields, mental health, obstetrics and gynecology, public health, allied health, and other medical specialties, is a perfect assistant in drawing Health diagrams, schematics, illustrations, infographics and slides for presentations on the healthcare, medical and health sciences thematic, in development knowledge in health science, in studying and representing the physical, mental and social aspects of human health, in determining the role of different health sciences at this process, finding and explaining new methods of treatment different diseases, making an overview and describing the main characteristics of health sciences in a visual form.

bubble diagram, circle-spoke diagram, marketing diagrams, circular arrows diagrams, segmented cycle diagram, Venn diagram, draw logical relations Business Diagrams

bubble diagram, circle-spoke diagram, marketing diagrams, circular arrows diagrams, segmented cycle diagram, Venn diagram, draw logical relations
The Business Diagrams Solution extends ConceptDraw DIAGRAM with an extensive collection of professionally designed illustrative samples and a wide variety of vector stencils libraries, which are the real help for all business-related people, business analysts, business managers, business advisers, marketing experts, PR managers, knowledge workers, scientists, and other stakeholders allowing them to design the bright, neat, expressive and attractive Bubble Diagrams, Circle-Spoke Diagrams, Circular Arrows Diagrams, and Venn Diagrams with different quantity of sets in just minutes; and then successfully use them in documents, reports, statistical summaries, and presentations of any style.

Basic of Flowchart: Meaning and Symbols

Flowcharts are the best for visually representation the business processes and the flow of a custom-order process through various departments within an organization. ConceptDraw DIAGRAM diagramming and vector drawing software extended with Flowcharts solution offers the full set of predesigned basic flowchart symbols which are gathered at two libraries: Flowchart and Flowcharts Rapid Draw. Among them are: process, terminator, decision, data, document, display, manual loop, and many other specific symbols. The meaning for each symbol offered by ConceptDraw gives the presentation about their proposed use in professional Flowcharts for business and technical processes, software algorithms, well-developed structures of web sites, Workflow diagrams, Process flow diagram and correlation in developing on-line instructional projects or business process system. Use of ready flow chart symbols in diagrams is incredibly useful — you need simply drag desired from the libraries to your document and arrange them in required order. There are a few serious alternatives to Visio for Mac, one of them is ConceptDraw DIAGRAM. It is one of the main contender with the most similar features and capabilities.
How to Build a Flowchart

audit flowchart, fiscal flowchart, audit steps, chart audits, chart auditor, auditing process, audit process flowchart, audit planning process Audit Flowcharts

audit flowchart, fiscal flowchart, audit steps, chart audits, chart auditor, auditing process, audit process flowchart, audit planning process
Audit flowcharts solution extends ConceptDraw DIAGRAM software with templates, samples and library of vector stencils for drawing the audit and fiscal flow charts.

Cloud computing, Architecture Diagrams, Cloud Computing Architecture, How Cloud Computing Works, amazon cloud computing architecture, introduction to cloud computing architecture Cloud Computing Diagrams

Cloud computing, Architecture Diagrams, Cloud Computing Architecture, How Cloud Computing Works, amazon cloud computing architecture, introduction to cloud computing architecture
The Cloud Computing Diagrams solution extends the functionality of the ConceptDraw DIAGRAM diagramming software with a comprehensive collection of libraries of commonly accepted cloud computing vector stencils to help you to get started designing Cloud Computing Diagrams, Architecture Diagrams and Cloud Computing Architecture Diagrams without effort. This solution lets one professionally depict the way how the cloud computing works, allows giving a powerful introduction to the Cloud computing architecture and Amazon cloud computing architecture, to display the essence of the cloud computing, the main characteristics and classification of the cloud services thanks to the wide variety of predesigned samples and examples.

climate change, waste management, esg, sustainability, diversity, supply chain, biodiversity Environmental, Social, and Corporate Governance

climate change, waste management, esg, sustainability, diversity, supply chain, biodiversity
The Environmental, Social, and Corporate Governance solution with diversity of drawing tools, libraries of pre-made vector elements, and thematic samples is the best to illustrate the key points of ESG, specify ESG criteria and ESG risks. This helps investors evaluate potential investments and avoid investment losses. Outline ESG factors and ESG standards to protect the environment, avoid climate change and biodiversity loss, illustrate principles of sustainability, waste management, supply chain management, and the importance of the use of renewable energy and renewable resources. Depict easily the policies of the companies that adhere to ESG standards.

Hybrid Network Topology

A network topology is the topological structure or the arrangement of different elements of computer network. There are several basic types of network topologies, such as star, ring, bus, mesh. But the most popular is a combination of two or more diverse basic network topologies, which is known as hybrid network topology. The examples of hybrid topology are: star-bus, star-ring topologies, etc. Each resulting hybrid topology has its own features, advantages and limitations of its components. Hybrid network topologies are more flexible, reliable, and have increased fault tolerance, the faults in them can be easily diagnosed and corrected, new nodes can be easily added. But at the same time hybrid topologies often are sufficiently expensive and difficult for managing. ConceptDraw DIAGRAM diagramming and vector drawing software supplied with the tools of Computer Network Diagrams solution from Computer and Networks area is perfect for schematic description various types of computer network topologies and easy designing Hybrid network topology diagrams.

customer journey, journey map, customer journey mapping tools, journey mapping, customer experience map, consumer journey, user journey, customer mapping, experience map, customer journey mapping process Customer Journey Mapping

customer journey, journey map, customer journey mapping tools, journey mapping, customer experience map, consumer journey, user journey, customer mapping, experience map, customer journey mapping process
Customer Journey Mapping Solution for ConceptDraw DIAGRAM opens incredibly broad opportunities for marketing and business specialists, product managers, designers, engineers, and other people interested in business development, increasing the product’s audience, its success and users' demand, providing them with capabilities of customer journey mapping. The included diagramming and customer journey mapping tools, predesigned vector customer journey mapping icons and charts, consumer journey mapping connectors, user journey and customer mapping figures, customer experience map icons and touchpoint icons, quick-start templates and samples provide excellent conditions for the customer journey mapping process, for creating Customer Journey Map and Customer Experience Map.