"In elementary algebra, a quadratic equation (from the Latin quadratus for "square") is any equation having the form
ax^2+bx+c=0
where x represents an unknown, and a, b, and c are constants with a not equal to 0. If a = 0, then the equation is linear, not quadratic. The constants a, b, and c are called, respectively, the quadratic coefficient, the linear coefficient and the constant or free term.
Because the quadratic equation involves only one unknown, it is called "univariate". The quadratic equation only contains powers of x that are non-negative integers, and therefore it is a polynomial equation, and in particular it is a second degree polynomial equation since the greatest power is two.
Quadratic equations can be solved by a process known in American English as factoring and in other varieties of English as factorising, by completing the square, by using the quadratic formula, or by graphing." [Quadratic equation. Wikipedia]
The flowchart example "Solving quadratic equation algorithm" was created using the ConceptDraw PRO diagramming and vector drawing software extended with the Mathematics solution from the Science and Education area of ConceptDraw Solution Park.
Solving quadratic equation flow chart

Mathematical Diagrams

Quality Control Chart Software — ISO Flowcharting

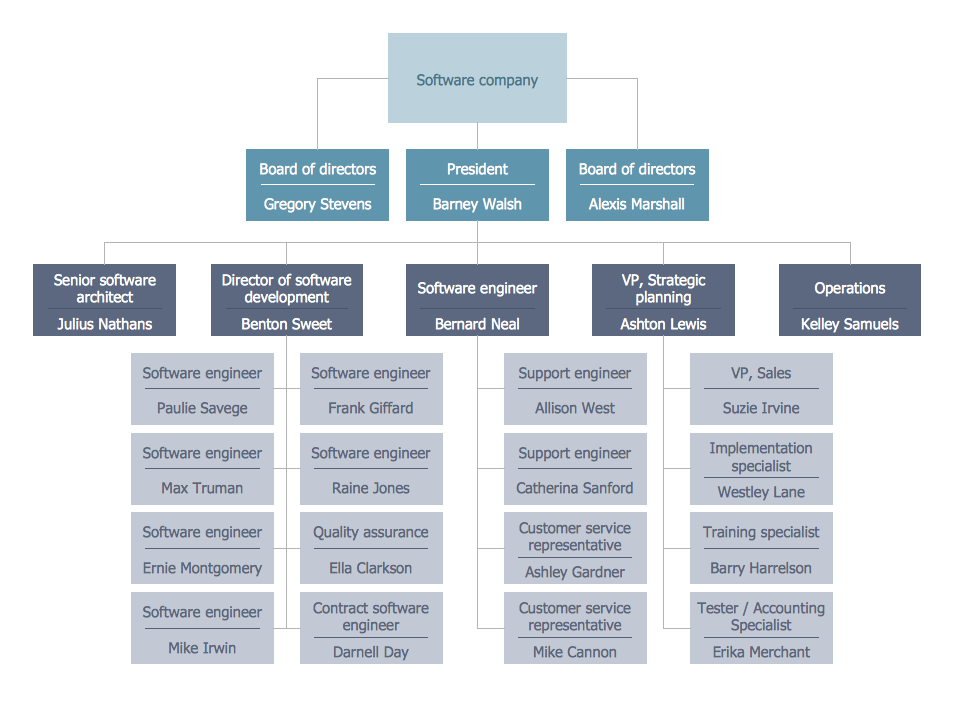
Matrix Organization Structure

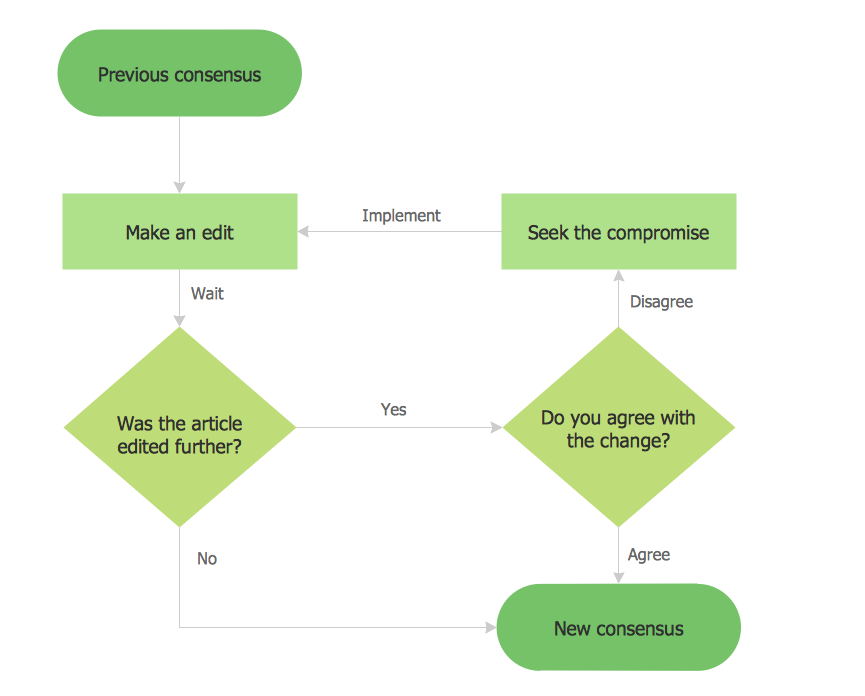
Cross-Functional Flowchart (Swim Lanes)

Example Basic Flowchart. Flowchart Examples
Making Diagrams Has Never Been Easier
Business Structure
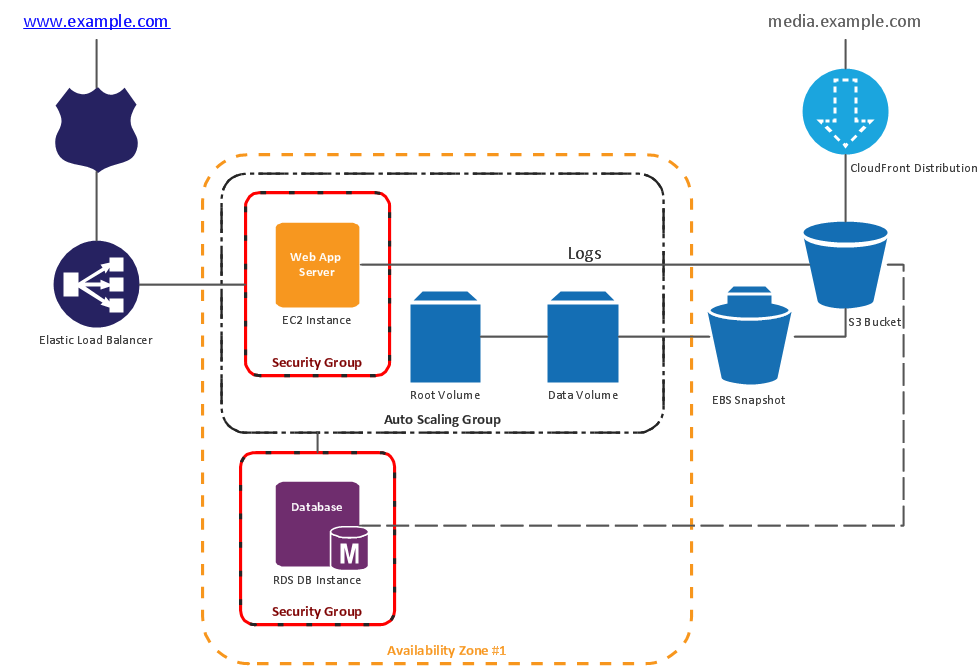
Control and Information Architecture Diagrams (CIAD) with ConceptDraw DIAGRAM

IDEF0 standard with ConceptDraw DIAGRAM

Organization Chart Templates

Gantt Chart Software

Software development with ConceptDraw products

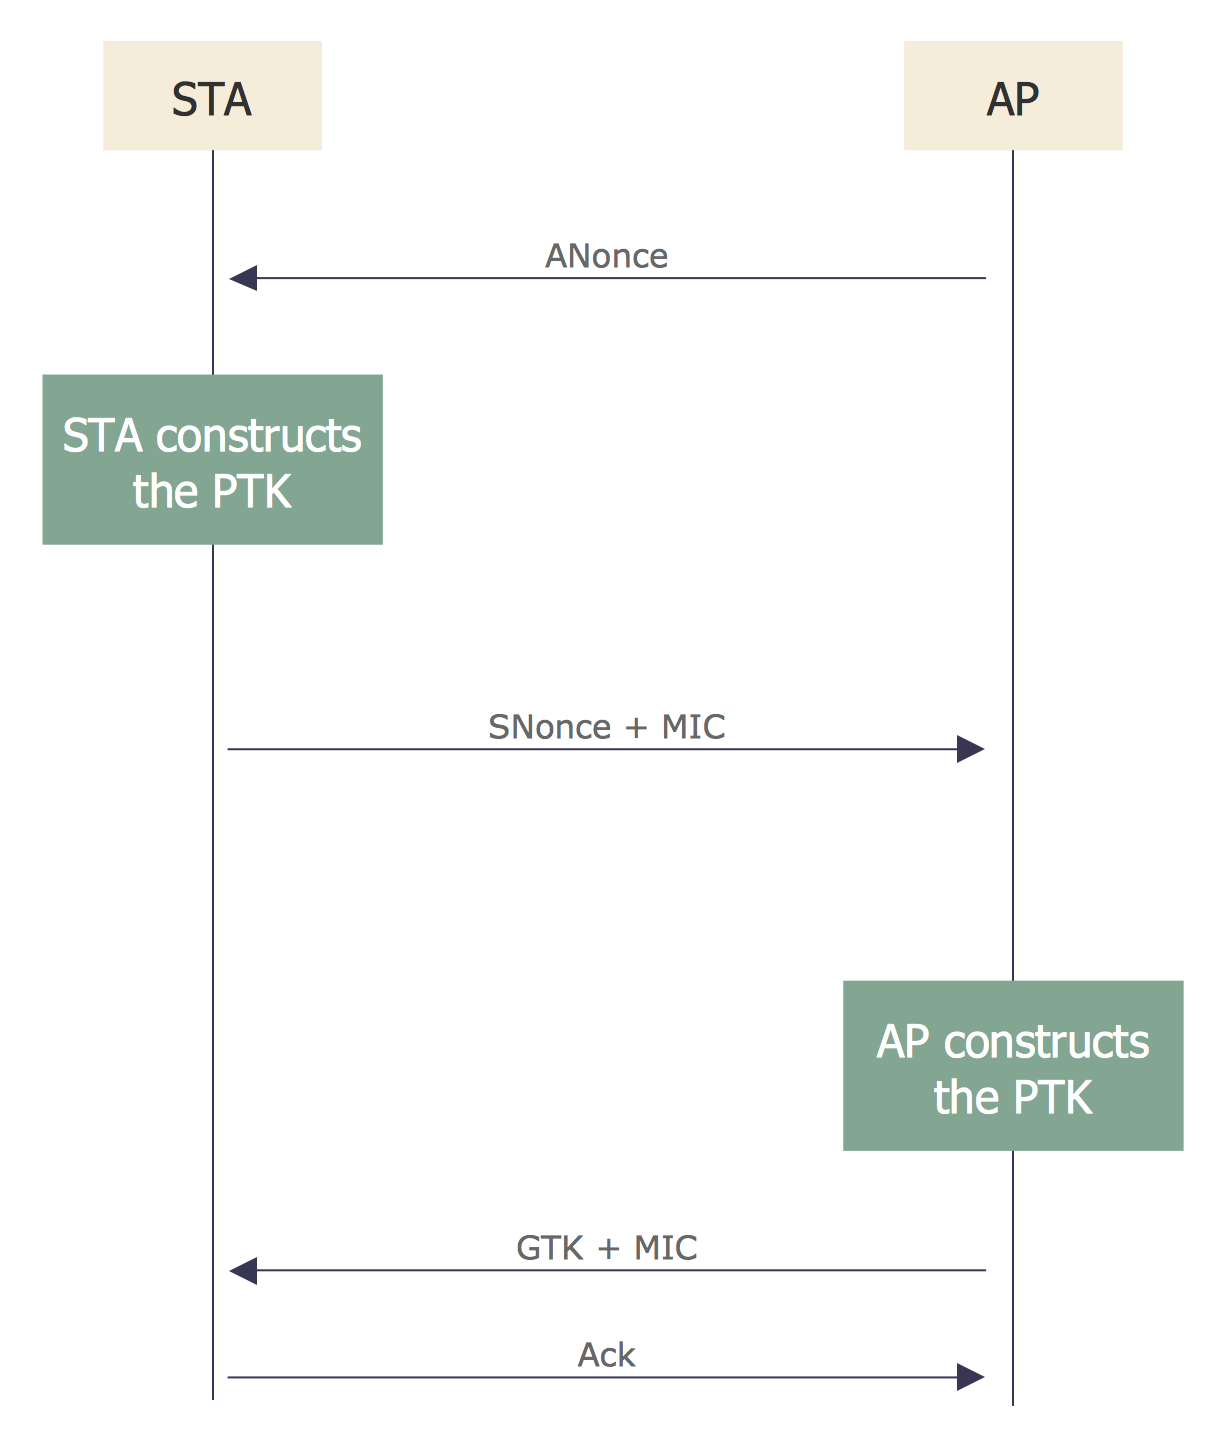
Sequence Diagram for Cloud Computing
 Scatter Diagrams
The Scatter Diagrams solution extends ConceptDraw DIAGRAM functionality with templates, samples, and a library of vector stencils that make construction of a Scatter Plot easy. The Scatter Chart Solution makes it easy to design attractive Scatter Diagrams used in various fields of science, work, and life activities. ConceptDraw DIAGRAM lets you enter the data to the table and construct the Scatter Plot Graph automatically according to these data.
- Draw A Flow Chart To Solve The Root Of A Line Equation Of Degree 2
- Solving quadratic equation algorithm - Flowchart | Basic Flowchart ...
- Draw A Flowchart To Solve The Roots Of A Line Equation Of Degree 1
- Euclidean algorithm - Flowchart | Solving quadratic equation ...
- Solving quadratic equation algorithm - Flowchart | Draw A Flowchart ...
- Solving quadratic equation algorithm - Flowchart | Draw A Flowchart ...
- Solving quadratic equation algorithm - Flowchart | Mathematics ...
- Solving quadratic equation algorithm - Flowchart | Drow A Flow ...
- Solving quadratic equation algorithm - Flowchart | Chemistry ...
- Draw A Flow Chart To Solve In The Root Of Linear Equation Of Degree
- Solving quadratic equation algorithm - Flowchart | Basic ...
- Solving quadratic equation algorithm - Flowchart | Draw A Flowchart ...
- Solving quadratic equation algorithm - Flowchart | Algorithm To ...
- Solving quadratic equation algorithm - Flowchart | Solving quadratic ...
- Solving quadratic equation algorithm - Flowchart | Horizontal ...
- Solving quadratic equation algorithm - Flowchart | Basic ...
- Flow Chart To Get A Solution Of Quadratic Equation Ax^ 2 Bx C=0
- Solving quadratic equation algorithm - Flowchart | Venn Diagram ...
- Solving quadratic equation algorithm - Flowchart | Scientific Symbols ...