How to Build a Flowchart
The ConceptDraw DIAGRAM is a professional software for quick creating great looking flowcharts. The vector stencils from object libraries allows you to use RapidDraw technology. By the clicking on direction arrows one can add new object to flowcharts. This technology gives to users the ability to fast creating visualization for the structural data. Learn the basics of flowcharting and see how to build create a flowchart using ConceptDraw automatic drawing tools. Flowchart Design Flowchart Symbols, Shapes, Stencils and Icons
A flowchart is a type of diagram which represents an algorithm, process or workflow, displays the steps as boxes of various kinds and depicts their order by connecting them with arrows. Any business graphic document will be more colorful and understandable if will use professional-looking and visual diagrams and flowcharts. Flowchart design gives versatile presenting and explaining of the process.
ConceptDraw DIAGRAM flowchart software enhanced with Flowcharts solution helps effectively make Flowchart Design. Use of predesigned flowchart symbols and bright color palette offers a fresh view and favorably distinguishes the flowcharts designed in ConceptDraw DIAGRAM from the black and white flowcharts on a paper. Preferably to use no more than three or four colors and apply identical for the same shape types. The best flowchart design can be achieved by starting with Flowchart template, or any of suitable ready examples or samples offered in ConceptDraw STORE, open one of them and enter the proper text into each Flowchart shape.
Each symbol of the flowchart has a definition that can't be changed. This means that all flowcharts shapes can be grouped in according to their meaning. Users with ConceptDraw DIAGRAM flowchart software can style groups of symbols with close definitions by color sets chosen from complementary palette.
Almost all workflows can be depicted as a flowchart. Colored diagrams are more light for perception of the certain information, this is part of flowchart design. Bright colors need to be used in the key points of Decision symbols, to focus attention on their importance for whole process flow.

PERT Chart
The program (or project) evaluation and review technique, commonly abbreviated PERT, is a statistical tool, used in project management, which was designed to analyze and represent the tasks involved in completing a given project. ConceptDraw DIAGRAM diagramming and vector drawing software extended with Seven Management and Planning Tools Solution from the Management Area offers the extensive drawing tools for effective drawing the PERT Chart of any complexity.Activity Network (PERT) Chart
Activity Network and Project Evaluation and Review Technique, or PERT, charts are a way of documenting and analyzing the tasks in a project. This diagram is constructed as part of the process in creating a schedule of corrective actions. The Activity Network Chart (PERT) shows the logical connections and consequence of tasks to be performed. It displays the time period for problem solving and the implementation of all activities through the critical path.7 Management & Planning Tools
The 7 Management and Planning Tools solution available from ConceptDraw Solution Park implements well-known methodologies and provides the comprehensive set of tools for problems' analysis and solving. Different products from multifunctional ConceptDraw Office suite may be used as a complete solution for any of methodologies offered by this solution and provide a visual communication during every stage of work. Use the MINDMAP 7 Management & Planning Tools for step-by-step identification and analysis the problems, for planning solving and corrective actions, and also countermeasures to address the risks. 7 Management and Planning Tools solution is perfect for managers in medium to large companies, who require effective tools to address the management issue, for business consultants, trainers and coaches to help visualize the problem's solving by using 7 MP Tools methodology, to structure the problem's affecting factors, analyze their root causes and cause and effect relations, to highlight drivers and indicators factors, to prioritize factors using ranking by criteria set.Drawing Workflow Diagrams
Drawing workflow diagrams combines both creative and analytic practice. To be the most effective in this process you should find a software that suites this kind of practice. Using ConceptDraw DIAGRAM software for drawing workflow diagrams you get support of features, libraries, templates and samples boosts you creativity and keep you focus on analytic practice, not drawing specifics.
 Venn Diagrams
Venn Diagrams are actively used to illustrate simple set relationships in set theory and probability theory, logic and statistics, mathematics and computer science, linguistics, sociology, and marketing. Venn Diagrams are also often used to visually summarize the status and future viability of a project.
 Network Layout Floor Plans
Network Layout Floor Plans solution extends ConceptDraw DIAGRAM software functionality with powerful tools for quick and efficient documentation the network equipment and displaying its location on the professionally designed Network Layout Floor Plans. Never before creation of Network Layout Floor Plans, Network Communication Plans, Network Topologies Plans and Network Topology Maps was not so easy, convenient and fast as with predesigned templates, samples, examples and comprehensive set of vector design elements included to the Network Layout Floor Plans solution. All listed types of plans will be a good support for the future correct cabling and installation of network equipment.
 Seven Management and Planning Tools
Seven Management and Planning Tools solution extends ConceptDraw DIAGRAM and ConceptDraw MINDMAP with features, templates, samples and libraries of vector stencils for drawing management mind maps and diagrams.
The Best Business Process Modeling Software: Comprehensive Guide
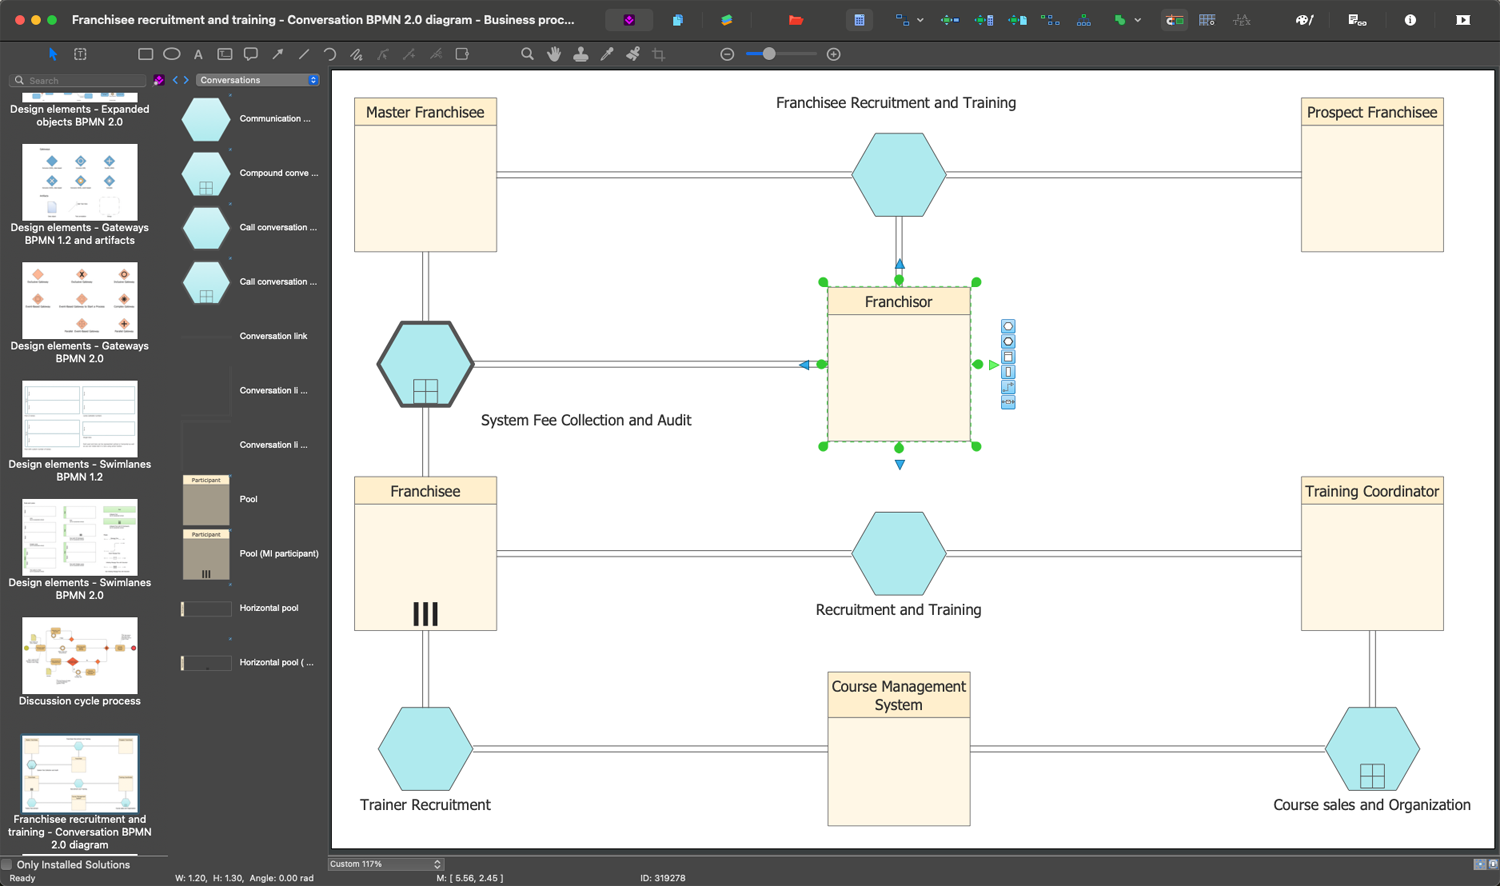
ConceptDraw DIAGRAM is a best business processes modeling software for graphical documenting processes of the company. ConceptDraw has 142 vector stencils in the 8 libraries that helps you to start using Diagramming Software for designing own Business Process Diagrams.
 Timeline Diagrams
Timeline Diagrams solution extends ConceptDraw DIAGRAM diagramming software with samples, templates and libraries of specially developed smart vector design elements of timeline bars, time intervals, milestones, events, today marker, legend, and many other elements with custom properties, helpful for professional drawing clear and intuitive Timeline Diagrams. Use it to design simple Timeline Diagrams and designate only the main project stages, or highly detailed Timeline Diagrams depicting all project tasks, subtasks, milestones, deadlines, responsible persons and other description information, ideal for applying in presentations, reports, education materials, and other documentation.
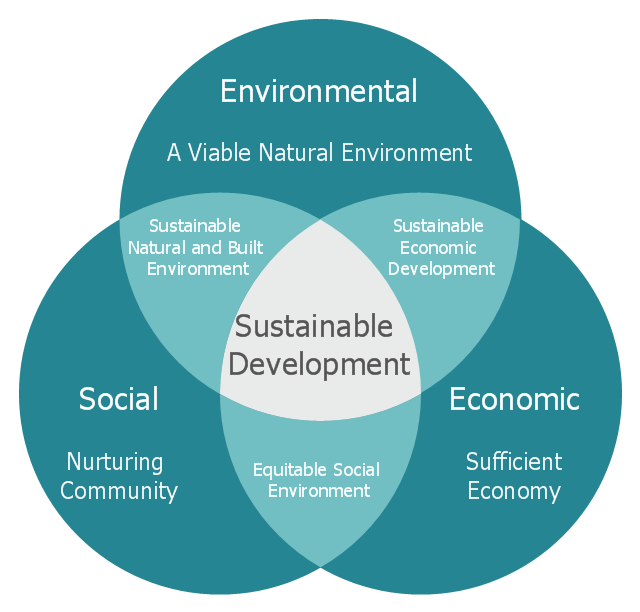
This Venn diagram sample depicts the path to sustainable development.
"Sustainable development is an organizing principle for human life on a finite planet. It posits a desirable future state for human societies in which living conditions and resource-use meet human needs without undermining the sustainability of natural systems and the environment, so that future generations may also have their needs met.
Sustainable development ties together concern for the carrying capacity of natural systems with the social and economic challenges faced by humanity. As early as the 1970s, 'sustainability' was employed to describe an economy "in equilibrium with basic ecological support systems." Scientists in many fields have highlighted The Limits to Growth, and economists have presented alternatives, for example a 'steady state economy', to address concerns over the impacts of expanding human development on the planet." [Sustainable development. Wikipedia]
The Venn diagram example "Path to sustainable development" was created using the ConceptDraw PRO diagramming and vector drawing software extended with the Venn Diagrams solution from the area "What is a Diagram" of ConceptDraw Solution Park.
 Project Diagrams
The Project Diagrams solution extends the ConceptDraw DIAGRAM software functionality with special tools, large set of samples pre-made in ConceptDraw DIAGRAM and ConceptDraw MINDMAP, and collection of predesigned vector shapes, arrows, table and frame objects for easy drawing the Project Diagrams of different kinds, Hierarchical Charts, Influence Diagrams, Work Breakdown Structures (WBS), Organization Breakdown Structures (OBS), and Resource Breakdown Structures (RBS), PERT Chart or PERT Diagram, Project Management Chart, Project Network Diagram, Network Diagram Project Management, Project Timeline, Precedence Diagram, Gantt Diagram or Gantt Chart. Plan your project, visualize the main stages, and track your project’s implementation effectively with ConceptDraw DIAGRAM. Use also ability to autogenerate Project Diagrams from ConceptDraw MINDMAP to ConceptDraw DIAGRAM.
Physics Symbols
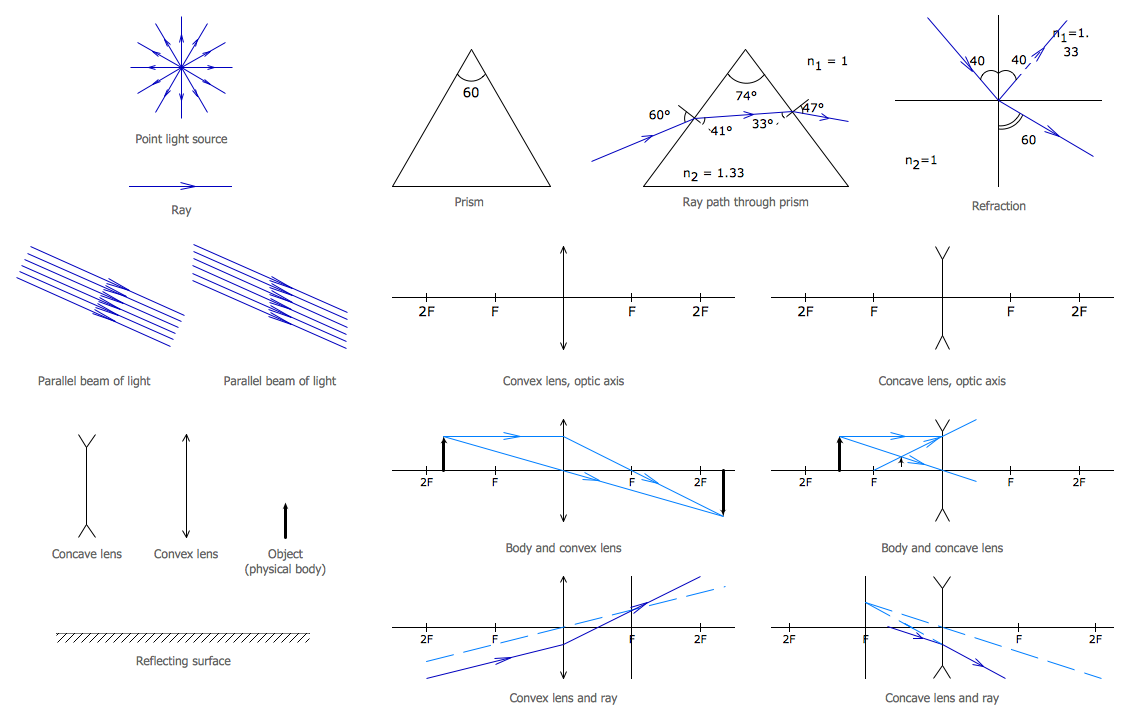
ConceptDraw DIAGRAM diagramming and vector drawing software extended with Physics solution from the Science and Education area is a powerful software for creating various physics diagrams. Physics solution provides all tools that you can need for physics diagrams designing. It includes 3 libraries with predesigned vector physics symbols: Optics Library, Mechanics Library and Nuclear Physics Library.
 Workflow Diagrams
Evaluate all advantages of workflow diagram software ConceptDraw DIAGRAM extended with the Workflow Diagrams solution that includes workflow examples and samples, workflow diagram template, a library of workflow diagram symbols and pictorial vector clipart for drawing visual and intuitively understandable Workflow diagrams. Design pictorial Work flow chart or Work flow diagram easier than ever, use them for documentation and implementation purposes, export in a variety of common graphics formats and share with colleagues. Extend the already wide area Work flow diagrams' applications that are used today in the manufacturing industry, software development, HR, medicine, banking and finance sphere, education, military, government, business, e-commerce, and many other fields.
Beautiful Nature Scene: Drawing
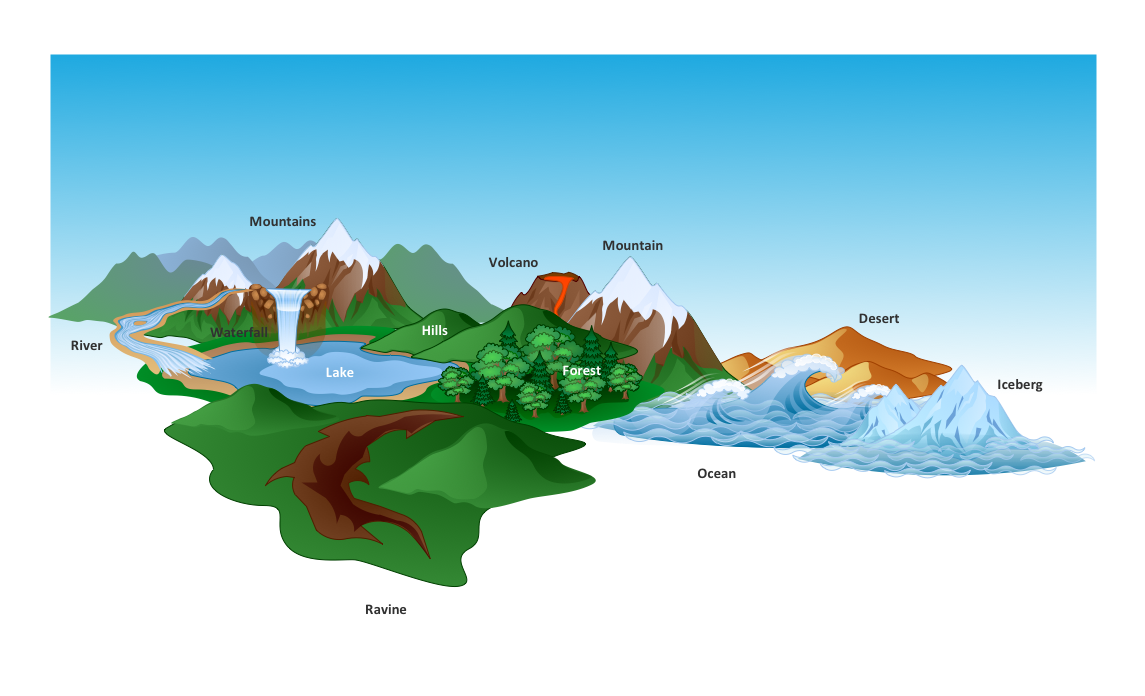
The Nature Solution addition to ConceptDraw Solution Park for ConceptDraw DIAGRAM includes new libraries that provide a wide range nature objects and it can be used to augment documentation and graphics. Draw beautiful nature scenes using ConceptDraw DIAGRAM software with Nature solution.
 Marketing Diagrams
Marketing Diagrams solution extends ConceptDraw DIAGRAM diagramming software with abundance of samples, templates and vector design elements intended for easy graphical visualization and drawing different types of Marketing diagrams and graphs, including Branding Strategies Diagram, Five Forces Model Diagram, Decision Tree Diagram, Puzzle Diagram, Step Diagram, Process Chart, Strategy Map, Funnel Diagram, Value Chain Diagram, Ladder of Customer Loyalty Diagram, Leaky Bucket Diagram, Promotional Mix Diagram, Service-Goods Continuum Diagram, Six Markets Model Diagram, Sources of Customer Satisfaction Diagram, etc. Analyze effectively the marketing activity of your company and apply the optimal marketing methods with ConceptDraw DIAGRAM software.
 Business Diagrams
The Business Diagrams Solution extends ConceptDraw DIAGRAM with an extensive collection of professionally designed illustrative samples and a wide variety of vector stencils libraries, which are the real help for all business-related people, business analysts, business managers, business advisers, marketing experts, PR managers, knowledge workers, scientists, and other stakeholders allowing them to design the bright, neat, expressive and attractive Bubble Diagrams, Circle-Spoke Diagrams, Circular Arrows Diagrams, and Venn Diagrams with different quantity of sets in just minutes; and then successfully use them in documents, reports, statistical summaries, and presentations of any style.
Electrical Circuits — Electrical Symbols
A circuit diagram or wiring diagram uses symbols to represent parts of a circuit. Electrical and electronic circuits can be complicated. Making a drawing of the connections to all the component parts in the circuit's load makes it easier to understand how circuit components are connected. Drawings for electronic circuits are called "circuit diagrams". Drawings for electrical circuits are called "wiring diagrams". 26 libraries of the Electrical Engineering Solution of ConceptDraw DIAGRAM make your electrical diagramming simple, efficient, and effective. You can simply and quickly drop the ready-to-use objects from libraries into your document to create the electrical diagram.
 Basic Circuit Diagrams
Basic Circuit Diagrams solution extends the functionality of ConceptDraw DIAGRAM application with a large variety of samples and internationally standardized electrical symbols and electrical circuit diagram symbols including resistor symbol, inductor, amplifier, relay, diode symbol, icons for electrical engineering equipment, electrical circuit instrumentation, active and passive components, digital electronics symbols. Use them to illustrate the electrical circuit of any kind and complexity in minutes, design electrical schematic, wiring diagram, electronic schematics, and more. This solution is effective for electrical engineers, architects, electricians, electrical technicians, builders, interior designers, and many more electricity-related specialists.
- Critical Path Method in ConceptDraw PROJECT | Types of Flowchart ...
- Highlight The Principles Of Sustainable Development With Help The ...
- ConceptDraw PROJECT Project Management Software Tool ...
- Opportunity flowchart - Order processing | Basic Flowchart Examples ...
- How To Show Critical Path in ConceptDraw PROJECT Server ...
- Types of Flowchart - Overview | Definition TQM Diagram | Flow chart ...
- Types of Flowchart - Overview | SWOT matrix template | SWOT ...
- Process Flowchart - Overview | Issue Management Flow Diagram
- How to Connect Social Media DFD Flowchart with Action Maps ...
- Process Flowchart | Critical Tasks | PM Planning | Analytical Work


